Download
1 / 21
210 likes | 311 Views
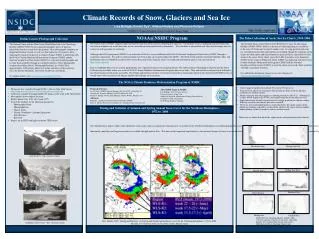
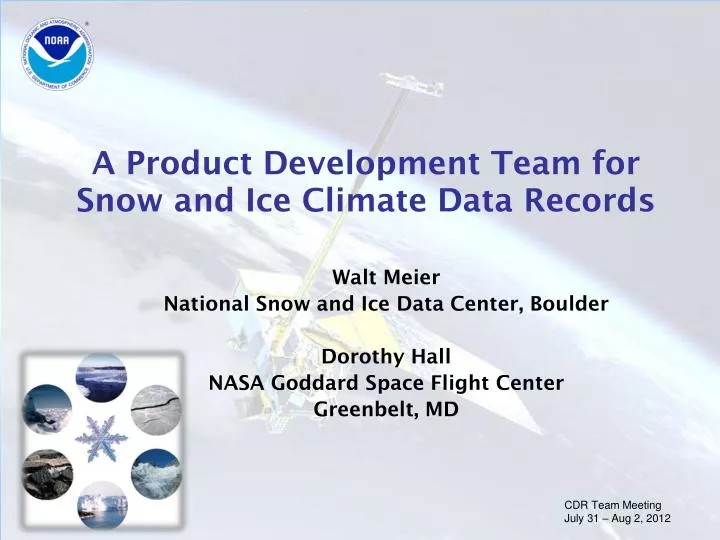
A Product Development Team for Snow and Ice Climate Data Records. Walt Meier National Snow and Ice Data Center, Boulder Dorothy Hall NASA Goddard Space Flight Center Greenbelt, MD. CDR Team Meeting July 31 – Aug 2, 2012. Project Description: Overview.

E N D
A Product Development Team for Snow and Ice Climate Data Records Walt Meier National Snow and Ice Data Center, Boulder Dorothy Hall NASA Goddard Space Flight Center Greenbelt, MD CDR Team Meeting July 31 – Aug 2, 2012
Project Description: Overview • The cryosphere product development team is coordinating the generation, validation, and archival of fundamental and thematic snow and ice climate data records. • Our goal is to refine, extend, validate, document, and archive visible, infrared, and passive microwave cryosphere products. We are building on existing efforts, coordinating with other funded products, as appropriate. • Products include sea ice concentration, extent, thickness, and age; snow cover; snow/ice surface temperature and albedo; polar cloud properties; surface shortwave and longwave radiation.
Project Description: Personnel • Jeff Key (PI), NOAA/NESDIS • Xuanji Wang, University of Wisconsin • Yinghui Liu, University of Wisconsin • James Maslanik, University of Colorado • Walt Meier, University of Colorado • Mark Tschudi, University of Colorado • Charles Fowler (ret), University of Colorado • Julienne Stroeve, University of Colorado • William Emery, University of Colorado • Dorothy Hall, NASA/GSFC
Ice Motion • Algorithm: • Daily sea Ice motion based on correlating successive daily passive microwave images. • Correlation also performed simultaneously with IABP ice buoy trajectories and NCEP surface winds. • Validation: • Product has been validated vs. various data sets by multiple investigators. These efforts will continue. • The effects of loss of tracking during parts of the summer (due to surface melt) on ice motion errors is being evaluated.
Ice Age • Algorithm: • Lagrangian tracking of ice to determine age, in years • Utilizes ice motion vectors • Validation: • Compare spatial patterns of ice age to aircraft data from multiple existing efforts [e.g. NASA IceBridge flights (imagery and LIDAR profiling)] • Examine temporal and spatial consistency compared to complementary satellite data (ICESat, QuikSCAT, ENVISAT)
Concentration Passive Microwave Sea Ice Concentration • Algorithm: • Combined NASA Team and Bootstrap • Bootstrap ice edge • Selects higher concentration value • Spatial standard deviation field of both of algorithm estimates as data quality indicator • Validation: • Both algorithms have had numerous validation studies conducted, comparisons with in situ, airborne, and higher resolution satellite data • CDR concentration estimates compared with individual algorithm products 15 March 2007 Standard Deviation 15 March 2007
Melt Onset • Drobot-Anderson Algorithm: • Passive microwave temperature difference between 19 and 37 GHz channels • SSM/I, SSMIS 15 March 2007 Melt Melt onset is included as part of the PM sea ice concentration product in the quality assessment field. Arctic only. < 50% Coast Quality Assessment
Ice Concentration and Ice Mask from vis/IR • Algorithm: • Ice mask: Group threshold tests • Ice concentration: tie-point algorithm • GOES-R algorithm. Similar algorithm used for JPSS. • AVHRR near visible and near infrared channel data, and surface temperature retrieved. • Validation: • Validation is done through comparison with PM ice concentration.
Sea ice thickness/age - Energy budget method Sea Ice Thickness • Algorithm: • One-dimensional Thermodynamic Ice Model (OTIM) based on the surface energy budget at the equilibrium state. • Algorithm for GOES-R. Similar algorithm for JPSS. • Validation: • OTIM retrieved ice thickness with AVHRR, MODIS and SEVIRI were validated with in-situ observations, e.g., from submarine, mooring, and meteorological stations (Wang, Key, and Liu, 2010)
AVHRR Polar Pathfinder 5 km EASE-Grid Composites • Algorithm: • Remap AVHRR level 1b data to 5 km EASE-Grid and make the composites at 0400 and 1400 local solar time (LST) in the Arctic, and 0200 and 1400 LST in the Antarctic. • Five AVHRR channels, viewing angles, and Universal Coordinated Time (UTC) of acquisition. • This product (APP) provides the brightness temperatures, reflectances, and viewing and illumination geometry needed for the generation of APP-x. Channel 1, Julian day 90, 2011
APP-x Ice/snow surface temperature (IST) • Algorithm: • Split window technique using AVHRR channel 4 and 5 with cloud adjustment for cloudy sky condition for snow and ice surface. • Similar method used for JPSS. • AVHRR channel 4 & 5 or equivalent sensors with near-infrared and atmospheric window channels. • Validation: • APP-x products were validated with in-situ observations (Xuanji Wang and Jeffrey R. Key, 2005, Arctic Surface, Cloud, and Radiation Properties Based on the AVHRR Polar Pathfinder Data Set. Part I: Spatial and Temporal Characteristics, J. Climate, Vol.18, No.14, 2558-2574, 2005.) Surface Skin Temperature
APP-x Ice/snow surface broadband albedo Surface Broadband Albedo • Algorithm: • Using AVHRR channel 1 and 2 with cloud adjustment for cloudy sky condition. • AVHRR channel 1 & 2 or equivalent sensors with optical channels.
APP-x surface shortwave and longwave radiation • Algorithm: • Forward radiative transfer calculation using a neural network version of radiation transfer model and derived products for clouds and surface properties. • All AVHRR channels Surface shortwave radiation flux, downward
Greenland clear-sky surface temperature Surface Skin Temperature • Algorithm: • Split window technique using MODIS bands 31 & 32 • MODIS Terra & Aqua • Greenland only • Validation: • MODIS Greenland ISTs for the winter of 2008-09 at Summit, Greenland, were compared with ground measurements showing ~3K lower temperatures under clear sky conditions than in-situ measurements; further validation using AWS data is ongoing (see Hall et al., J. Climate).
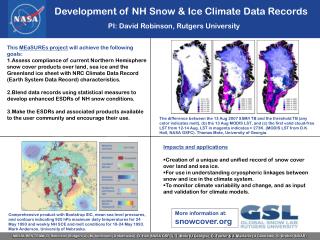
Northern Hemisphere Snow Extent Earth System Data Records Assess compliance of current NH snow cover products over land, sea ice and the Greenland ice sheet with NRC Climate Data Record (Earth System Data Record) characteristics Blend data records using statistical measures to develop enhanced, ESDRs of NH snow conditions Make the ESDRs and associated products available to the user community via an existing web site (http://climate.rutgers.edu/snowcover/) and encourage their use. Use MODIS snow products for validation of enhanced ESDR, and for snow mapping since 2000
A Changing Cryosphere is Important - Globally Changes in the cryosphere can have significant impacts on water supply, transportation, infrastructure, hunting, fisheries, recreation, and ecology. Sea level rise threatens vital infrastructure. Changes in sea-ice affect access to the polar oceans and resources, tourism, and security. Declining summer sea-ice affects ocean circulation and weather patterns. Natural hazards such as icebergs, avalanches and glacier outburst floods create risks. Permafrost thawing impacts infrastructure and is potentially a major source of methane, a greenhouse gas. Changes in the cryosphere impact water supply, transportation, food production, freshwater ecosystems, hydropower production. Retreating sea ice results in a loss of habitat for mammals such as polar bears and seals.
Applications • Ice Age • Provided to J. Davies, Pew Environmental Group (http://www.pewenvironment.org) and Oceans North (http://www.oceansnorth.org) to examine exploratory fisheries and potential ecosystem shifts in the high arctic • To P. Schaefer, NORAD and USNORTHCOM, for identifying various ice floe ages • Ice Motion • To R. Sambrotto, Lamont-Doherty Earth Observatory, to estimate biological productivity in the marginal ice zone • Ice Concentration • Provided to modelers at NCAR for comparison/validation of model fields • Wildlife management • The ice age product has been used to assess potential long-term survival of polar bears and for research aircraft flight planning (http://content.usatoday.com/communities/sciencefair/post/2010/12/ice-refuge-may-be-polar-bears-last-stand/1). • Long-term national defense planning • Sea ice products have been used in discussions with NORTHCOM in planning for the next decade.
Benefit to the Science Community • User communities: Climate scientists, modelers (for verification), remote sensing scientists, Global Cryosphere Watch (GCW) • Scientific discovery: • The loss of the oldest, thickest Arctic sea ice continues at a record pace through mid-2011. Viewed along with model estimates of low ice volume at the start of the melt season, it is likely that ice extent for September 2011 will continue the recent history of extreme seasonal minima. The thinner ice cover is responding more dramatically to synoptic-scale variation both in the winter and summer (e.g., Maslanik, et al. Geophys. Res. Lett., July 2011). • Changes in sea ice concentration and cloud cover played major roles in the magnitude of recent Arctic surface temperature trends. Significant surface warming associated with sea ice loss accounts for most of the observed warming trend. In winter, cloud cover trends explain most of the surface temperature cooling in the central Arctic Ocean. • APP-x was used to study of controls on snow albedo feedback (SAF), which is important for assessing the validity of feedbacks in global climate models. • An analysis of passive microwave sea ice concentration and MODIS cloud amount quantifies the effect of changes in sea ice extent and concentration on cloud amount. A 1% decrease in sea ice concentration corresponded to 0.36~0.47 percent increase in cloud amount from July to November, suggesting a further decline in sea ice cover will result in a cloudier Arctic. • Surface-temperature measurements of the Greenland Ice Sheet can be used to study temperature and melt trends.
Schedule & Issues • State project status and plans for next phase of the project • This is the end of the third, and last, project year. • There have been some variations on the products that were originally proposed, but all datasets have been, or will be in the very near future, generated. • With additional funding, these research projects can be transitioned to NCDC ops. • State any risks or concerns • A no-cost extension was requested. • It is unclear exactly what is required to transition the products and documentation to NCDC. The requirements that have been discussed since last year are beyond the scope of what was originally proposed, e.g., ATBDs, providing source code, data formats. • Does NCDC want to/need to host all products? Some datasets are better left at elsewhere, e.g., passive microwave sea ice concentration at NSIDC; MODIS snow cover at GSFC. This needs to be discussed. • How can the CDR Program better assist you?