Download
1 / 29
290 likes | 371 Views
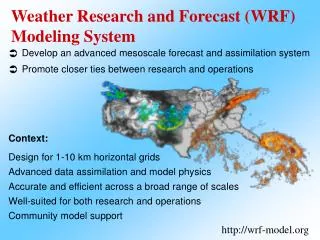
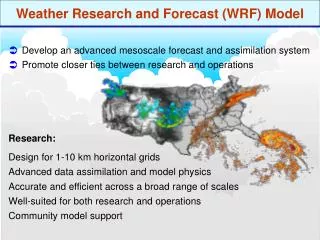
Steering and Launching a 5km WRF Forecast Using Siege. July 13, 2006. Run Parameters. Fixed 5 KM grid spacing NAM data for input WRF-SI used as initialization User configurable Forecast start time and length Number of processors to use in computation Submission host

E N D
Steering and Launching a 5km WRF Forecast Using Siege July 13, 2006
Run Parameters • Fixed • 5 KM grid spacing • NAM data for input • WRF-SI used as initialization • User configurable • Forecast start time and length • Number of processors to use in computation • Submission host • NCSA’s tungsten supercomputer • Input and output data locations
Overview • Create a new experiment • Define domain • Select a start time by choosing appropriate NAM file • Define a 600km x 600km domain • View input data in IDV, move bounding box • Launch and monitor • Watch event notifications • View results in IDV
Prolog • Shut down and tidy up • Exit IDV • Remove existing Siege installation • On desktop, right click on Siege icon, delete
Install Necessary Software: Siege Client • Get Siege client: • http://eeyore.ncsa.uiuc.edu/gridcomputing/siege/ • Open with compressedFolder • Drag result to desk top
Install Necessary Software: IDV Plugin • Get IDV plugin • http://www.unidata.ucar.edu/projects/LEAD/IDV-addons/ • Click on siege.jar, choose “save to disk” • Drag to: • My Computer -> C: -> Documents and Settings -> Workshop -> .metapps -> DefaultIDV -> plugins
Launch Siege • Open seige folder • Click on shield icon • Login as etrainX, where X is the number we’ve assigned to you • Password is Un1data!
Close the Intro Window Click on the X in the window’s tab
Set Preferences • File -> Preferences -> Workshop Preferences • Set Default User Name • Spaces will be removed • Set Default Forecast Length to 6 • Set Default Processor Count to 8 • Click Apply, click OK
Create a New Experiment • File -> New -> Unidata Workshop -> Workshop Experiment • Click Next
Name the Experiment • Give it a name • Click Finish
Close the Editor Window Window -> Hide Editors ->
Pick a Start Time • Pick a start time from NAM data pull down menu
Determine a Center Lat/Lon via IDV Click on button that launches IDV This will launch the IDV and make the input dataset the selected dataset in the field selector
Set Bounding Box in IDV (1) 1 2 4 • In IDV, go to Dashboard window • In Dashboard, select Field Selector • Your input file should be the highlighted choice • Under Fields pick a field for this data • Under Displays, pick “Contour Plan View” (saves memory) • Under Times, pick the number of hours you need for your forecast time (6 or 12) (saves memory) • Click Create Display 5 3 6
Set Bounding Box in IDV (2) In IDV main window, start animation, stop on timestep having weather of interest
Set Bounding Box in IDV (3) • In IDV, select Displays -> Special -> Siege Control • Get screenshot from Tom
Set Bounding Box in IDV (4) • In the IDV Field Selector the Display Controls tab is open • Click Write Siege File • This makes Siege the active window
Set Bounding Box in IDV (5) • Your center lat/lon should appear in Siege • If you want to look at other possible input data, repeat previous process starting from selecting input data from pull down menu.
Set Forecast Length • Keep six hour forecast as default, or pick twelve hours
Use Eight Processors For our workshop, we’ll stick with eight processors
Launch Your Experiment Click the green launch button. If you get a Windows Firewall Security Alert, just click OK.
Monitor Your Experiment As the Siege client receives event notifications, the status of each step is flagged Successful completion (Failure is indicated by a red X.) Running
See the History of Experiments • Get Experiment History Window • Window -> Show View -> Other -> Unidata Workshop -> Workshop Experiment History
Experiment History Window Clicking on an experiment name will bring up the window for that experiment
Get Current Status of an Experiment Start/stop event listening • Update status information by clicking on the right arrow, which has the tip “Start Listening for Events” • The box icon to the right turns off event listening
View Experiment Output in IDV (1) • Window -> Show View -> Unidata Workshop -> Experiment Output
View Experiment Output in IDV (2) • In Experiment Output view, click on desired experiment • This puts that dataset into the Field Selector of the IDV and selects it (like before) where it can be viewed