Download
1 / 10
100 likes | 115 Views
Learn how to calculate the mean, median, mode, and range for any data set. Examples and step-by-step instructions provided.

E N D
12.2 – Measures of Central Tendency Learning Target I can determine the following for any data set: mean median mode range 1
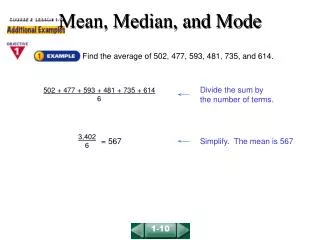
The Mean Mean: The sum of the data items divided by the number of items. Mean = Σx , n where Σx represents the sum of all the data items and nrepresents the number of items. 2
The Median Median is the data item in the middle of each set of ranked, or ordered, data. To find the median of a group of data items, 1. Arrange the data items in order, from smallest to largest. 2. If the number of data items is odd, the median is the data item in the middle of the list. 3. If the number of data items is even, the median is the average, or mean of the two middle data items. 4
Example 2: Calculating the Mean for a Frequency Distribution The table to the right shows the students’ responses to the question “How stressed have you felt in the last 2 ½ weeks, on a scale of 0 to 10, with 0 being not stressed at all and 10 being as stressed as possible?” Use the frequency distribution to find the mean of the stress-level ratings. 6
Example 3: Finding the Median Find the median for each of the following groups of data: • 84, 90, 98, 95, 88 • 68, 74, 7, 13,15, 25, 28, 59, 34, 47 7
Example 7: Comparing the Median and the Mean Five employees in a manufacturing plant earn salaries of $19,700, $20,400, $21,500, $22,600 and $23,000 annually. The section manager has an annual salary of $95,000. • Find the median annual salary and the mean annual salary for the six people. • Discuss your findings. 8
The Mode • Mode is the data value that occurs most often in a data set. If more than one data value has the highest frequency, then each of these data values is a mode. If no data items are repeated, then the data set has no mode. Example 8: Finding the mode • 7, 2, 4, 7, 8, 10 9
Sorting a List To find the mode, you can always put the data into a list in the calculator and then sort the data items to see which one occurs the most. Find the mode: 1, 5, 9, 9, 8, 5, 7, 6, 12, 3, 4, 5, 5, 9, 8, 6, 7, 3, 2, 1, 1, 4, 0. • Put all data items in List 1. • Hit “STAT”, arrow down to “SortA(“, hit “2nd” “L1”, then enter. • Go back to your list and look for the mode. 10