Download
1 / 96
960 likes | 983 Views
An online traffic management system for incident management, queue length prediction, travel time estimation, and evaluating detour operations.

E N D
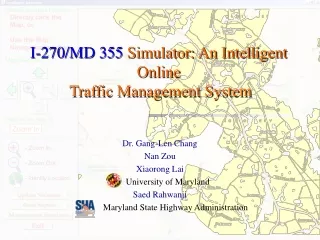
I-270/MD 355 Simulator: AnIntelligent Online Traffic Management System Dr. Gang-Len Chang Nan Zou Xiaorong Lai University of Maryland Saed Rahwanji Maryland State Highway Administration
Functions • Incident Management Functions • Estimating the incident duration and the maximum impact range • Predicting the dynamic evolution of queue length • Estimation of travel time vs. departure time during the period of incident management • Evaluating the effectiveness of detour operations
Functions • Incident Management Functions • Estimating the incident duration and the maximum impact range • Predicting the dynamic evolution of queue length • Estimation of travel time vs. departure time during the period of incident management • Evaluating the effectiveness of detour operations
Functions • Incident Management Functions • Estimating the incident duration and the maximum impact range • Predicting the dynamic evolution of queue length • Estimation of travel time vs. departure time during the period of incident management • Evaluating the effectiveness of detour operations
Functions • Incident Management Functions • Estimating the incident duration and the maximum impact range • Predicting the dynamic evolution of queue length • Estimation of travel time vs. departure time during the period of incident management • Evaluating the effectiveness of detour operations
Functions • Incident Management Functions • Estimating the incident duration and the maximum impact range • Predicting the dynamic evolution of queue length • Estimation of travel time vs. departure time during the period of incident management • Evaluating the effectiveness of detour operations
Functions (cont’d) • Additional functions • Changing signal timings • Changing the acceleration and deceleration lanes • Ramp closure or ramp metering • Automatic update of traffic volume from real-time data
Functions (cont’d) • Additional functions • Changing signal timings • Changing the acceleration and deceleration lanes • Ramp closure or ramp metering • Automatic update of traffic volume from real-time data
Functions (cont’d) • Additional functions • Changing signal timings • Changing the acceleration and deceleration lanes • Ramp closure or ramp metering • Automatic update of traffic volume from real-time data
Functions (cont’d) • Additional functions • Changing signal timings • Changing the acceleration and deceleration lanes • Ramp closure or ramp metering • Automatic update of traffic volume from real-time data
Functions (cont’d) • Additional functions • Changing signal timings • Changing the acceleration and deceleration lanes • Ramp closure or ramp metering • Automatic update of traffic volume from real-time data
Example Scenario • Date: August 8th, 2003 • Time: 9:25AM • Location: 2500 feet south of Exit 4 • Traffic Direction: South • Lane Blockage: 2 right lanes closed
Map navigation function Use arrow buttons to navigate the covered area
Input the distance from the incident location to Exit 4
Criteria to search similar cases in the knowledge base 2 similar cases from the knowledge base Time information for the current incident Estimate the incident duration based on the historical data Search similar cases at all locations
132 similar cases from the knowledge base Search similar cases for Collision, Personal Injury
52 similar cases from the knowledge base Set the duration of the current incident to 50 minutes
This screen shows the summary of the information for the current incident Execute the simulation
Two types of chart display Display the outputs for both I-270 and MD 355 Four categories of output Display the output chart for the selected time period Display the output chart for selected segment Display outputs by segment or over time Map-based output Animation output This is the output screen Display the bar chart
Display the delay over time on MD 355 segment from Shady Grove Rd to Grosvenor Ln
Display the output of the average speed by segment for I-270