Download

1 / 42
420 likes | 701 Views
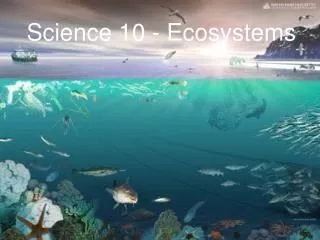
Life Sciences: Sustainability of Ecosystems. Science 10. Define the following words:. ecosystem carnivore amphibian omnivore food chain detritus producer decomposer consumer habitat herbivore. Section 1.1. The Silence of the Frogs.

E N D
Life Sciences: Sustainability of Ecosystems Science 10
Define the following words: ecosystem carnivore amphibian omnivore food chain detritus producer decomposer consumer habitat herbivore
Section 1.1 The Silence of the Frogs about 30% of North America’s frogs and toads are in danger adapted to climate changes such as drought, flood, and winter ice survived the ice age amphibians have been around for more than 400 million years
Why are Scientists Concerned? the health of the amphibians indicates the health of the ecosystems they live in they can signal changes in both aquatic and terrestrial environments exposed to hazards in two ecosystems (water as eggs and tadpoles and forest & grassland as adults) a change in either of their ecosystems can result in a loss of population.
Frogs are good environmental indicators • if they start to die off it is a sign that the ecosystem is in trouble. Frogs breathe through their skin • they may be more sensitive to pollution and provide early warning of serious problems part of two different food chains see Figures 2 and 3 on page 11
If frogs disappeared, what would happen to their ecosystems?
Why Are Frogs Disappearing? Some Factors Affecting Frog Populations 1. Loss of Habitat • Frogs need clean water, a forest or field, and a safe path between them to survive • Roads are being built and forests are being cut down • Ponds are drained to create farm land
2. Air and Water Quality • Frogs breathe through their thin skin and pollutants are also able to pass through it • Acid rain and chemicals in the water cause the frogs to become sick. It also affects their ability to reproduce 3. Ultraviolet Radiation • Frog skin can be damaged by the sun just as ours can 4. Climate Change • Global warming increases temperatures and reduces wetland Video Clip: Feeling the Heat with Frogs
Assignment: Read pages 10-13 and answer questions 1-6. Read the article “Last Chance “ and answer the questions below. Please copy the questions and answer them in complete sentences as your work will be marked. (12 points) 1. What lead to the rapid decline of the Kihansi spray toads? (1) 2. How is the Kihansi spray toad unique from other amphibians? (1) 3. Why should we be concerned about protecting the frogs? (give at least 2 reasons) (1) 4. Why are frogs so sensitive to pollution? (1) 5. The chytrid fungus has been linked to the declining frog populations. Explain what is believed to be the origin of this fungus. (1) 6. How do scientists believe they can help treat the chytrid fungus once the frogs are in captivity? (1) 7. List the 6 threats, from the article, that frogs are facing and briefly explain how each one has played a role in the decline of the frog populations. (6)
Section 1.2 Canada’s Endangered Species As of 2011, 602 species are classified by the Committee on the Status of Endangered Wildlife in Canada (COSEWIC) as being at risk, including 262 Endangered, 151 Threatened, 166 Special Concern (Vulnerable), 23 Extirpated Species In addition, 13 species are Extinct. Link to various endangered species PEI Piping Plover Video
Species at Risk Categories Video Clip: Species At Risk
Assignment Read pages 14-15 and complete questions 1, 2 and 4 on page 15.
Section 1.3 Extinction in the Modern World Humans have sped up or caused the extinction of many species in the past 25 years. It is thought that over 500 million different species have existed on Earth and that over 90% have either become extinct or evolved into new species. Mass Extinction
Causes of Extinctions Asteroids large asteroids hit the Earth & caused a large cloud of dust that blocked the light from the sun and set off many volcanoes The extinction of dinosaurs (65 million years ago) is thought to have been caused by an asteroid. There is a crater in Mexico that is 10 km deep and 300 km wide and dates back to that time.
Climate Change A change in a species environment forces them to adapt or die. Competition If a new species arrives it may cause competition for the same food sources and/or habitat. One wins, the other adapts or dies. Human Factors Logging, oil exploration, expanding cities, expansion of agriculture, introduction of new species
Effects of Extinction Biodiversityis the number of different species in an ecosystem. • all species in an ecosystem are linked, and a change in one species causes a domino effect.
Restoring Balance • allowing or forcing just one species to become extinct could be disastrous • it would take many years to figure out all of the consequences. Biodiversity Video
Assignment Read pages 16-19 and complete questions 1 - 3 on page 19. Species at Risk Research (see project outline)
Section 1.5 Ecology Ecology the study of how organisms interact with each other Ecology focuses on the following: a)examining organisms within their natural setting b)how organisms interact with their environment c) how factors in the environment affect an organism’s growth, feeding habits and reproduction
Abiotic Factors Nonlivingfactors that can affect an organism such as: Amount of sunlight Temperature changes Strength and direction of wind Biotic Factors The effect of living things on the ecosystems such as: predators prey competitors for food and reproduction
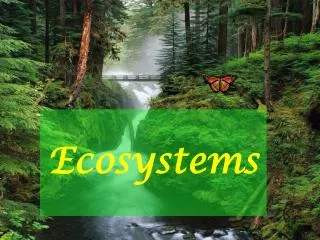
Organisms do not live in isolation • group themselves with others of their own kind forming a POPULATION • populations of different organisms will interact and form a COMMUNITY • communities of different organisms will also interact with all the biotic and abiotic factors in an area creating an ECOSYSTEM
This pond ecosystem consists of a pond habitat with populations of aquatic plants, waterside plants, micro-organisms (in the mud at the bottom of the pond), minnows and herons. The organisms together make up a community of living things.
Ecotone transition area between two different ecosystems where species from each can interact. There is often greater biodiversity in the ecotone than in either of the two ecosystems bordering it. any area with greater biodiversity is less fragile. ( gives consumers more choices for food sources, so if one disappears, they have others) An ecotone helps guard against extinction.
Questions to ponder: 1. How are weeds different from plants? 2. How do abiotic factors affect the distribution of weeds?
Section 1.8 Comparing Ecosystems Artificial ecosystems are ones that humans made or maintained. • fish tank, farms, parks Natural ecosystems are made by nature. • Species are able to interact with their surroundings freely. Humans will still have an impact on the ecosystem but they do not control it.
Assignment Read pages 22-23 and complete questions 1 – 5 on page 23. Complete the Comparing Ecosystems Assignment • Nature Walk • Handout explaining Mini-poster and Marking Rubric
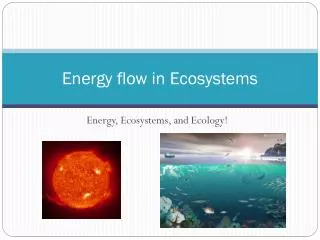
Section 1.11 Following Energy Movement in Ecosystems Energy is constantly moving within ecosystems. To understand how living things gain their energy we must look at trophic levels. Most ecosystems only contain about three trophic levels. All organisms are either: Autotrophs -make their own food (producers) Heterotrophs -can’t make their own food (consumers)
Energy is passed through the TROPHIC levels of an ecosystem. Trophic means “feeder”.
Every organism in an ecosystem provides energy for other organisms. Food Chains provide a step by step sequence of who eats whom in an ecosystem. Ex. Plants Rabbits Wolves
When several food chains are connected a Food Web is created. • graphical representation of the feeding relationships between organisms in an ecosystem. • A single organism can be a part of many food chains. • The most stable ecosystems (greatest biodiversity) have such complex food webs that the removal of one producer or consumer does not have a great negative affect on the other food chains in the web.
Limits on Energy Transfer Energy is constantly changing forms and moving within ecosystems. Thermodynamics is the study of energy changes. The sun’s energy must obey the laws of thermodynamics: 1)First Law – energy can be changed from one form to another, it cannot be created or destroyed 2) Second Law – during energy changes some of the energy is lost in the form of heat and therefore cannot be passed on
Limits on Energy Transfers and the Number of Trophic Levels There is a limit on the energy transfer within a food chain. Only about 10% of the available energy in a lower trophic level is transferred to the next trophic level. 10% 10% Plants Rabbits Wolves The other 90% is used within the original trophic level for reproduction, living, growing and waste (feces &heat loss).
Calculating energy efficiency This cow has eaten 100 kJ of energy in the form of grass, and excreted 63 kJ in the form of feces, urine and gas. The energy stored in its body tissues is 4 kJ. So how much has been used up in respiration?
Energy can’t just disappear (Law of Thermodynamics). The total amount of energy used up by the cow must equal the total taken in as food. Total Energy = 100kJ Energy Accounted for = 63kJ + 4kJ = 67kJ Energy for Respiration = 100kJ - 67 kJ = 33kJ. We can also work out the energy efficiency at each trophic level by dividing the useful energy output by the total energy input. Multiplying this fraction by 100 gives you the percentage efficiency. Useful Energy for the next trophic level = 4kJ Total Energy Input for the cow = 100kJ Energy Efficiency for the cow = 4/100 x 100 = 4%
Assignment: Complete Questions 1-10 on page 39. Food Chain Song
Ecological Pyramids Energy transfers in ecosystems can be graphed. 1)PYRAMID OF ENERGY- represent energy flow through the food chain or web. Measured in kilojoules or calories 2)PYRAMID OF NUMBERS–represent the number of organisms at each trophic level of a food chain 3) PYRAMID OF BIOMASS– the dry mass (water removed) of all the organisms at each trophic level. Measured in kilograms
Assignment Read pages 34-39and complete questions 11 and 14 on page 39. Chapter 1 Review Questions: page 46 #1,2,3,4,6,9 Complete Chapter 1 ReviewSheets for the test