Download
1 / 23
230 likes | 344 Views
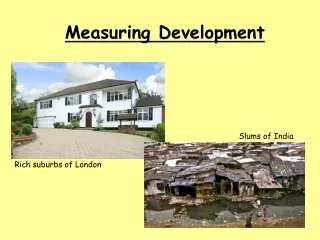
This presentation, by Roland Michelitsch from the IFC, explores the significance of measuring development results within the International Finance Corporation (IFC). It emphasizes the commitment to improve developmental outcomes through systematic evaluation and reporting, highlighting the increasing demand from stakeholders for accountability. Key components include assessing impacts of investment operations, improving living standards, and tracking progress through standardized indicators. The presentation advocates for a rigorous approach to measuring results to continually enhance the effectiveness of IFC's interventions in reducing poverty and fostering economic growth.

E N D
Measuring development results in IFC Evaluation Cooperation Group Washington, DC – June 6, 2007 Roland Michelitsch, Manager Development Effectiveness Unit, IFC
Why development results matter • IFC’s mission, purpose, articles • Commitment by IFC management • Increasing demand from the Board and other stakeholders • Commitment to report publicly • Continuously improve results: “What gets measured – gets done”
Assessing the impact of IFC activities How IFC/WBG helps to improve the investment climate and to reduce poverty & improve lives Investment Operations Demonstration Effects Improved Living Standards and Reduced Poverty Sustainable Private Investment Sustainable PSD Economic Growth Jobs, lower-cost or better goods & services (Sometimes directly for the poor) Advisory Services Improved Business Climate
IFC’S REPORTING ON DE Draw on past experience to inform new operations Disclosed: SUMMARY OF PROPOSED INVESTMENT (SPI) SUPERVISION (DOTS, PSR, XPSR) STRUCTURING (Legal Agreement) BOARD REPORT Development effectiveness: Feedback-loop EARLY REVIEW (PDS-ER) IFCInvestment Project Cycle Similar for Advisory Services INVESTMENT REVIEW (PDS-IR)
Tracking results • Investments and Advisory Services: Systematic, throughout the project cycle • Specify clear objectives up-front • Standardizing indicators, improving methods • Continuous tracking • Results feed into performance evaluations: Corporate departmental individual Ultimately Better results
Hierarchy of measures Market test or control group (with vs. w/o) Before-after Reach Funds disbursed
Assessing investment project’s development impact: by stakeholders Producers of Government, Taxpayer Customers Complementary Products Project Company (financiers) Neighbors & Environment Competitors New Entrants Employees Suppliers
Financial performance FRR > WACC Economic performance ERR > 10%, + qualitative aspects Social & Environmental Compliance with performance IFC’s safeguards Private sector Positive impact on development investment climate Development outcome framework: Investments Project level 4 indicators & satisfactory success standards (project finance example)
Measures for investments: Standard framework – aligned with ECG Good Practice Standards
Measuring: Reach Investments - last year’s reach: • 7.7M sub-loans to MSMEs for $52B • 2.4M patients, 320,000 students • Power: 12M, water: 9M customers • Last 10 years: 80M phone connections • Oil, Gas, Mining, Chemicals: $4.5B gov’t revenues, $1.8B local suppliers, 50,000 jobs, 85% with community development programs spent $218M
Measuring: Before-After Investments: MSME sub-loans from 68 FIs with consecutive data (27 micro, 41 SME): 2004 2005 Growth Number 1.1M 1.6M 40% Volume $13.0B $17.2B 32% [Forthcoming] IEG finding: Better results when investments combined with advisory services
Challenges • Comparisons • Success rates • Benchmarking institutions • Contemporaneous assessment • Aggregation
Challenge: Comparison Which institution performs best? Success rates • World Bank: • 75% for “outcome” (now > 80%) • EBRD: • 75% for “transition impact” (now > 80%) • 57% for “overall performance” (lower mainly due to financial performance) • IFC: • Investments: 60%for “development outcome”
Challenge: Benchmarking organizations • 2005: 2nd ECG benchmarking review: GPS for private sector investment operations • 2006: ECG comparison – advisory services • 2007 “IFI Comparison”: Investments and advisory services • Summary: Comparing systems, results not comparable
Challenge: Contempo-raneous assessment Mature Early Immature
Challenge: Aggregation • IFC’s development results: • Development outcome? • 59% success rate (unweighted average) • 67% success rate (volume-weighted) • Median: FRR 9.2% ERR 12.2% • Aggregate: FRR 7.9% ERR 12.9% • On $17.3B investment (15% IFC, 16% cofinanciers) Net benefits (real): Financiers Others Total Undiscounted $9.6B $6.6B $ 16B Discounted at 5% $2.8B $5.1B $ 8B Discounted at 10% -$1.6B $4.1B $2.5B Data: IFC’s Independent Evaluation Group (IEG)
For IFC projects: Close correlation between financial and development results
Better development results where investment climates improve
Development results measurement Summary: • Standard framework to assess project-level results • Consistent tracking throughout the project cycle • Supplemented by in-depth evaluations • Development results considered in corporate, departmental and individual performance evaluations