Download
1 / 7
80 likes | 193 Views
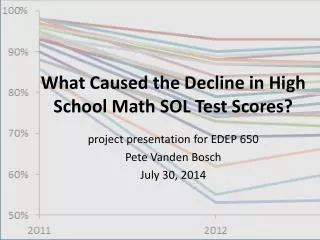
What Caused the Decline in High School Math SOL Test Scores?. p roject presentation for EDEP 650 Pete Vanden Bosch July 30, 2014. Project History. 12 July plan: Examine T. C. Williams HS math testing 18 July plan: Examine West Potomac HS math testing

E N D
What Caused the Decline in High School Math SOL Test Scores? project presentation for EDEP 650 Pete Vanden Bosch July 30, 2014
Project History • 12 July plan: Examine T. C. Williams HS math testing • 18 July plan: Examine West Potomac HS math testing • 21 July plan: Examine statewide math testing by individual SOL
Research Question What were the causes of the statewide drop in high school math SOL test scores from 2011 to 2012? Hypotheses: • A: The new SOLs were more rigorous • B: The new tests were more rigorous • Independent of any change in rigor in the SOLs. • C: Students and teachers had “learned” the old test format and approach. • D: The shift to electronic format (CAT) • E: Chance
Highly Consistent Pattern A: SOL rigor B: Test rigor C: Test learning D: CAT E: Chance
Main Data Collection/Analysis Scheme SOL competencies pre-2012 Test questions pre-2012 Test questions post-2012 SOL competencies post-2012
Analysis Results A: SOL rigor B: Test rigor C: Test learning D: CAT E: Chance • Observations: • More added than removed in Algebra I & II • More removed than added in Geometry • Can account for AT MOST: • Algebra I: 12% of the 19% drop • Geometry: 0% of the 13% drop • Algebra II: 8% of the 22% drop
RecommendationsAssuming my preliminary research holds up • VDOE clarity is needed: • Yes, some of the SOL competencies changed… • …but for those unchanged, did the tests get harder? • VDOE start connecting individual competencies to each test question • improves analysis of validity, reliability • educators might actually be able to use the results • Oversight of VDOE testing process and results