Download
1 / 68
680 likes | 829 Views
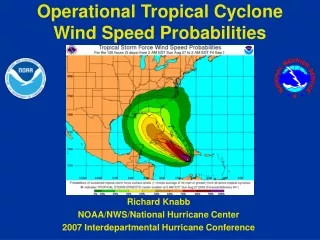
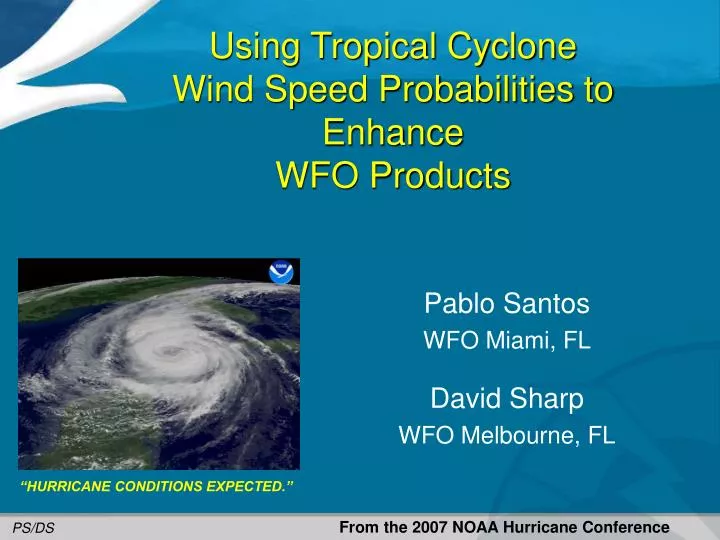
Using Tropical Cyclone Wind Speed Probabilities to Enhance WFO Products. Pablo Santos WFO Miami, FL David Sharp WFO Melbourne, FL. “HURRICANE CONDITIONS EXPECTED.”. From the 2007 NOAA Hurricane Conference. PS/DS. Two Training Modules. Proj #1: Using Tropical Cyclone

E N D
Using Tropical CycloneWind Speed Probabilities to EnhanceWFO Products Pablo Santos WFO Miami, FL David Sharp WFO Melbourne, FL “HURRICANE CONDITIONS EXPECTED.” From the 2007 NOAA Hurricane Conference PS/DS
Two Training Modules • Proj #1: Using Tropical Cyclone Wind Speed Probabilities in Public and Marine Products • Proj #2: Using Probabilistic Information to Generate Tropical Cyclone Impact Graphics (Graphical HLS)
Probability Definitions (A Quick Review) • Cumulative – The probability of sustained winds reaching or exceeding the specified wind speed threshold between the 00 hour forecast and a specified forecast hour. • These are used in the graphical HLS Project. • Individual (Interval) – The probability of sustained winds reaching or exceeding the specified wind speed threshold beginning during an individual 12 hour forecast period ending at the specified forecast hour (e.g., period of onset). • Not available in D2D, but within the PWSAT# text product. • Incremental –The probability of sustained winds reaching or exceeding the specified threshold during the 12 hour forecast period ending at the specified forecast hour. • These are the probabilities used in the enhanced public and marine forecast products (ZFP and CWF).
How well do the predicted probabilities of an event correspond to their observed frequencies? Reliability Diagrams What is the ability of the forecast to discriminate between events and non-events?Relative Operating Characteristics Diagrams How good are the Monte Carlo wind probabilities? Based upon a preliminary verification of Atlantic Monte Carlo Wind Probabilities • Probabilities have small negative biases • Probabilities are more skillful than the deterministic (i.e. OFCL) in determining if an event will happen • Predicted probabilities appear well related to observed frequencies • The Probabilities are skillful in their ability to discriminate between “events” and “non-events” Knaff and DeMaria, 61st IHC, New Orleans, 2007
Proposed WFO Use in ZFP and CWF(Item 42-05 from NOAA Hurricane Conference, 2005) • During potential high impact weather events such as tropical cyclones (TC), users not only demand our ‘best forecast’, but also require a corresponding expression of uncertainty for decision-making purposes. • Therefore, we are exploring the use of TC Wind Speed Probabilities to elevate the utility of official text products: • That is, to include situational expressions of uncertainty within the Zone Forecast Product (ZFP) and the Coastal Waters Forecast (CWF). • For WFOs, this effort crosses a major threshold for incorporating probabilistic data (other than PoP) within official National Weather Service forecast products.
Point-n-Click Web Version FRANCES (ZFP)
Message Sensitivity (Fostering One Forecast Message) Text Formatters: Logic Hierarchy Note: Forecast Uncertainty implies appreciation for the inherent errors regarding the forecast track, intensity, and size of the tropical cyclone.
Baseline Phraseology (The Nine Expressions of Uncertainty) • The *phrases are equivalent to imminent or ongoing conditions as • reflected in the 00-12 hour period simultaneously by the hazard, wind, and • probability grids. • The word EXPECTED is used in situations mainly during the Warning period, but is • also selectively used in the Watch period (e.g., Day 1 & 2, or out to period 4). • The word POSSIBLE is used during the extended period (e.g., Day 3 - 5), but is also • used in specific situations within Watch/Warning period. • Also, certain situations require compound phrases (e.g., when there is a Tropical • Storm Warning with a Hurricane Watch).
A Second Algorithm Example Advisory Time: 20040813_1500 (0-12 Hours – First Period) CHARLEY (ZFP) * Punta Gorda Hurricane Charley (ZFP)
Current & Future Work • Discuss GSD Role on this. • Conduct experiment during 2008 season • Generate case study examples from other locations and with an increasing variety of storms (real-time or archived) • Validate probability thresholds; perform ROC Diagram study • Evaluate consistency issues between the ZFP/CWF and their web page Point-n-Click counterparts • Evaluate consistency issues advisory to advisory • Compile experiences and share with the Tropical Cyclone Wind Team (present to NOAA Hurricane Conference - 2008) • Iterative Decision Points (considering user benefits) • Continue experimentally, implement officially, or discontinue • ZFP and CWF products • Click Point forecast web pages • Consider other applications (e.g., Point Forecast Matrices, etc.)
Tropical Cyclone Impacts Graphics David Sharp, Pablo Santos, Tom LeFebvre, Frank Alsheimer, and Tim Schott Threat Assessment Potential Impact DS/PS 2008
Hazard >> Threat >> Impact • TC Hazardsinclude high wind, storm surge and tide, flooding rain, and tornadoes. • Coastal WFOs (participating in the experiment) execute TC Threat Assessment Tools once tropical cyclone watches or warnings are issued for their forecast area. These tools consider: • forecast magnitude of hazard • forecast uncertainty of hazard • Final output is in the form of TC Potential Impact Graphics which are posted to the web as an experimental service. • Depictions are valid for the duration of the event, locally, but updated with each successive advisory from NHC, to include updates from HPC and SPC. Inland Flooding Impact
Potential Impact Graphics • The associated hazard is identified. • In context of event • The corresponding threat is quickly assessed through software applications and then delivered to the forecaster for limited editing. These SmartTools provide: • Automated first-guess fields on GFE • WFO forecaster expertise optionally applied • Output is converted to *.png graphics • The result is a simplified graphical expression that has been interpreted in terms of potential impact and provided to users via the web. • Color-coded graphics (and eventually grids) • Customer language • Locally calibrated definitions From the Practical Perspective: Inland Flooding Impact
National Web Site (Participating Coastal WFOs – 2008) http://www.weather.gov/os/tropical/index.php
Deterministic Wind WFO Wind Grids • NHC Official Forecast • WFO Enhancements • Mesoscale interactions • Terrain altitude • Windward vs. Leeward • islands • mountains • Gap winds • Large inland lakes • And so on… Jeanne (04)
High Wind – Tool Interface Tropical Cyclone Wind Threat 20
High Wind – Tool Interface Tropical Cyclone Wind Threat 21
Potential Impact Graphic High Wind Impact
Ideas For Future Work • NFUSE sponsored team work on identifying methods WFOs can use to enhance forecast products using data with products created with tools being developed for AWIPS II. • Members of this team should then work with Tracy to develop anything involving new text products or enhancement of existing text products. • The same with development of tools by having team members work with Tom. • In a nutshell, the method of how this new capability would be applied to products and services has to come from WSH and the field.
Results: Reliability Diagrams Atlantic, June 17 – October 4, 2006; 105W – 1W, 1N – 60N
Results: ROC Diagram 2% 5% skill 10% No skill
Triggers (First Period: When conditions are IMMINENT or ONGOING) • For a given zone or zone combination, in order to consider a situation as being imminent or ongoing within the first period of the text forecast requires: • Tropical Storm (Hurricane) Warnings to be in effect…AND…maximum Wind • forecast to be greater than or equal to 34 knots (64 knots)...AND…the 34 knot • (64 knot) Probability to be greater than or equal to the PWS34 threshold • (PWS64 threshold). Note: Initial probability thresholds were empirically-determined; future refinements are likely. This is true for each temporal interval of the forecast.
Triggers (Periods 1-4: When conditions are EXPECTED) • For a given zone or zone combination, invoking the wordEXPECTED for the specified period of the text forecast requires: • Tropical Storm (Hurricane) Warnings to be in effect…AND…maximum Wind forecast to be • greater than or equal to 34 knots (64 knots)…OR… • Tropical Storm (Hurricane) Warnings to be in effect…AND…maximum Wind forecast to be • greater than or equal to 25 knots (50 knots)…AND…the 34 knot (64 knot) Probability to be • greater than or equal to the PWS34 threshold (PWS64 threshold) according to the forecast • period.
Triggers (Periods 1-10: When conditions are POSSIBLE) According to the situation, the word POSSIBLE can be invoked anytime throughout the five-day forecast, and is the qualifier most often used within the enhanced phrasing. Within the 00-48 hour forecast, if imminent/ongoing criteria are not met, or EXPECTED criteria are not met, the word POSSIBLE is used whenever the probability thresholds are exceeded for the given time period. In the extended (e.g., beyond 48 hours), an additional constraint of winds > 20 knots is imposed.
Potential Impact Graphic (left) and NHC forecast (right) for Hurricane Charley 30 hours prior to landfall. Storm strengthened rapidly just prior to landfall and made landfall at Punta Gorda. The impact graphic shows that Tampa and Punta Gorda were both subject to an extreme impact. Both cities should have been preparing for a major hurricane! Run-to-Run Behavior Tampa Bay (A) vs. Punta Gorda (B) Hurricane Charley (04) A B 30
Inland Wind Impacts Initial Output From TCWindThreat Tool Orlando Arcadia Punta Gorda From NOAA/HRD Hurricane Charley – 081304_18z_highwind
Consistency & Continuity Hurricane Wilma (05) MLB MFL Initial output from tool. WilmaWindThreat 10/22/05 21z Minor tweaks by forecaster to handle slightly higher winds along the coast from KSC south. Matches up WFO to WFO as with other GFE elements. Potential Impact - Wind Potential Impact - Wind 32 Just over 36 hours from landfall on the SW Floridacoast
Coastal Flooding - Tool Inputs Approach: Utilize gridded probabilistic and deterministic storm surge input for the Surge Threat tool much like the Wind Threat tool. 10% Exceedance Wilma (05) Deterministic (SLOSH composite max) Probabilistic (as developed by MDL) 34
The Surge+Tide Tool • Threshold heights are established according to area concerns. • The GUI is set to default at traditional threshold heights, but can be manipulated through slider bars if desired. • The slider bar values must match your select threshold heights which correspond to your impact definitions on the Web site. • Also, you can simply add-on the effects of tide on top of your surge. However, more tool work is need to improve the effects of tide.
Closing Comments 2008 initiative for the national Experimental Tropical Cyclone Hazards for select offices. Graphical Hazards available from many local offices in graphical HLS; eventual migration to national page. Acquire all necessary input data in gridded form for GFE use. Complete Version 1.x of all SmartTools with GSD; use test data. Coordinate with other Threat/Impact teams (regional and national). 38
Inland Flooding - Tool Input ERP Grid HPC QPF/FFG Ratio Inland Flooding Impact WFO QPF (6 hr) RFC Gridded Flash Flood Guidance (6 hr) 40
Inland Flooding - Logic Review ERP Grid Excessive Rainfall Potential High Potential…15% or greater Moderate Potential…10 to 14% Slight Potential…5 to 9% Nominal Potential…1 to 4% Flooding Potential (QPF/FFG) High Potential… > 2.0 Moderate Potential… 1.0 to 1.99 Slight Potential… 0.75 to 0.99 Nominal Potential… < 0.75 QPF/FFG Ratio
Inland Flooding Tool - Output • Issues to Overcome • 6 hourly QPF and FFG • Multi-period events (accumulated rain; changing FFG) • Multi-day events (QPFmax ?) • Perhaps probabilistic QPF against FFG
Tornado - Tool Inputs • The tool uses the graduated SPC tornado probabilities, along with consideration for the strongest potential tornado (tornado vs. significant tornado; that is, the SPC ‘hatched’ areas). • The probabilities are extracted from the Day 1, Day 2, and Day 3 Probability Outlooks to determine the event composite maximum, which is returned to the forecaster as the first-guess field. • WFO enhancements are then advocated to account for local effects such as coastal convergence, low level boundaries, enhancements to the distribution of buoyancy/shear, etc. 45
Tornado - Logic Summary (for assessing Day1) • Part #1 - Assessing Day 1 … the Tornado SmartTool uses the logic contained in the table below to initialize the threat/impact output on GFE. The Probability of Tornado (ptor) guidance is used as the primary gridded input with threat level graduations sorted similarly to the SPC prescribed thresholds to foster message continuity. Then, to complete the Day 1 assessment, the tool checks the Probability of Significant Tornadoes (pxtor). If it is greater than or equal to 10 percent, it raises the derived level up by one.
Tornado - Logic Summary (for assessing Day 2) • Part #2 – Assessing Day 2 … the Tornado SmartTool then uses the logic contained in the table below to adjust the output. It uses the Probability of Total (Combined) Severe Weather (ptotsvr) and Total Significant Severe Weather (ptotxsvr) as a proxy for tornado probability. The thought is that given the physical expanse of tropical cyclones (given the existing TC Watch or Warning in your area), the threat for combined severe weather on Day 2 is most likely tornado related.
Tornado - Logic Summary (for assessing Day 3) • Part #3 – Assessing Day 3 … the Tornado SmartTool then uses the logic contained in the table below to further adjust the output. Once again it uses the Probability of Total (Combined) Severe Weather (ptotsvr) and Total Significant Severe Weather (ptotxsvr) as a proxy for tornado probability. Future updates of the tool will likely allow for user selection of which combination of days (e.g., of Day 1, Day 2, and/or Day 3) to include or exclude within the event composite maximum calculation.
Tornado - Impact Graphic Once tool execution is complete, the WFO forecaster can make refinements to account for local effects. Also, they may want to factor in the forecast uncertainty of the cyclone itself (e.g., track, intensity, and size), especially if the tornado threat is not confined to Day 1. When finished, the graphic is ready to be produced and posted to the web. 49 Tornado Impact
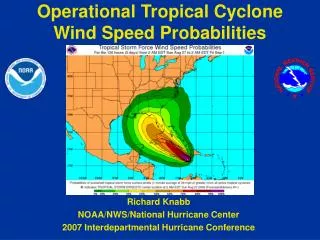
= EXAMPLE = 34 Knot (36 Hours) TC Wind Speed Probabilities on AWIPS-D2D (Incremental-form for 34-, 50-, and 64-knots) Hurricane Charley 2004 34 knot / 36 hour