fMRI
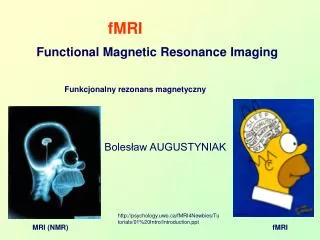
fMRI. Funkcjonalny rezonans magnetyczny. Functional Magnetic Resonance Imaging. Bolesław AUGUSTYNIAK. http://psychology.uwo.ca/fMRI4Newbies/Tutorials/01%20Intro/Introduction.ppt. MRI (NMR). fMRI. Spis zagadnień. Historia Zasad działania Aparatura fMRI Przykłady wykorzystania

fMRI
E N D
Presentation Transcript
fMRI Funkcjonalny rezonans magnetyczny Functional Magnetic Resonance Imaging Bolesław AUGUSTYNIAK http://psychology.uwo.ca/fMRI4Newbies/Tutorials/01%20Intro/Introduction.ppt MRI (NMR) fMRI
Spis zagadnień • Historia • Zasad działania • Aparatura fMRI • Przykłady wykorzystania • Wady i Zalety Bolesław AUGUSTYNIAKfMRI
Historia fMRI Bolesław AUGUSTYNIAKfMRI
E = mc2 ??? The First “Brain Imaging Experiment” … and probably the cheapest one too! Angelo Mosso Italian physiologist (1846-1910) “[In Mosso’s experiments] the subject to be observed lay on a delicately balanced table which could tip downward either at the head or at the foot if the weight of either end were increased. The moment emotional or intellectual activity began in the subject, down went the balance at the head-end, in consequence of the redistribution of blood in his system.” -- William James, Principles of Psychology (1890) [3] Bolesław AUGUSTYNIAKfMRI
Historia fMRI - współczesna In 1890 Roy and Sherrington's paper 'On the regulation of blood supply of the brain' suggested that neural activity was accompanied by a regional increase in cerebral blood flow. Until 1990 there was no way of non-invasively measuring the flow of blood in cortical areas. Ogawa and Lee at the AT and T Bell Laboratories discovered that the oxygenation level of blood acts as a contrast agent in MR images. They demonstrated that signals received from vessels were altered by drug-induced changes in blood flow from the brain. It was suggested that this is a consequence of changing the content of deoxyhemoglobin in the blood. http://people.ee.duke.edu/~jshorey/MRIHomepage/fmri.html Bolesław AUGUSTYNIAKfMRI
Conception of Blood Oxygenation Level Dependent (BOLD) MRI Contrast by Seiji Ogawa at AT&T Bell Lab. Ogawa S, Lee TM, Kay AR, Tank DW. “Brain magnetic resonance imaging with contrast dependent on blood oxygenation” Proc Natl Acad Sci U S A. 1990 Dec;87(24):9868-72. Ogawa S, Lee TM. “Magnetic resonance imaging of blood vessels at high fields: in vivo and in vitro measurements and image simulation” Magn Reson Med. 1990 Oct;16(1):9-18. Ogawa S, Lee TM, Nayak AS, Glynn P. “Oxygenation-sensitive contrast in magnetic resonance image of rodent brain at high magnetic fields” Magn Reson Med. 1990 Apr;14(1):68-78. Bolesław AUGUSTYNIAKfMRI
Blood Oxygenation Level-dependent Contrast Ogawa et al. MRM, 1990 - Oxyhemoglobin is diamagnetic (like biological tissue). - Deoxyhemoglobin (dHb) is paramagnetic!!! increase transverse relaxation rate (R2) of water protons induce susceptibility effect around dHb Mouse brain images at 360 MHz Breathing 100% O2 Breathing air Bolesław AUGUSTYNIAKfMRI
First Human fMRI Study JW Belliveau, DN Kennedy Jr, RC McKinstry, BR Buchbinder, RM Weisskoff, MS Cohen, JM Vevea, TJ Brady, and BR Rosen, “Functional mapping of the human visual cortex by magnetic resonance imaging”, Science, Vol 254, Issue 5032, 716-719, 1991 Bolesław AUGUSTYNIAKfMRI
746 papers (2001) fMRI - publikacje 800 700 600 500 Number of papers (PubMed) 400 300 200 Year of Publication 100 0 1990 1995 2000 Slide modified from Mel Goodale Bolesław AUGUSTYNIAKfMRI [3]
Zasada działania fMRI Bolesław AUGUSTYNIAKfMRI
Recipe for MRI • 1) Put subject in big magnetic field (leave him there) • 2) Transmit radio waves into subject [about 3 ms] • 3) Turn off radio wave transmitter • 4) Receive radio waves re-transmitted by subject • Manipulate re-transmission with magnetic fields during this readout interval [10-100 ms: MRI is not a snapshot] • 5) Store measured radio wave data vs. time • Now go back to 2) to get some more data • 6) Process raw data to reconstruct images • 7) Allow subject to leave scanner (this is optional) Source: Robert Cox’s web slides Bolesław AUGUSTYNIAKfMRI [3]
MRI fMRI MRI -> fMRI one image • fMRI • Blood Oxygenation Level Dependent (BOLD) signal • indirect measure of neural activity … neural activity blood oxygen fMRI signal Bolesław AUGUSTYNIAKfMRI
BOLD efect • Blood Oxygenation Level Dependent (BOLD) signal • indirect measure of neural activity • neural activity blood oxygen fMRI signal [2] Bolesław AUGUSTYNIAKfMRI
Adding a nonuniform object (like a person) to B0 will make the total magnetic field nonuniform This is due to susceptibility: generation of extra magnetic fields in materials that are immersed in an external field For large scale (10+ cm) inhomogeneities, scanner-supplied nonuniform magnetic fields can be adjusted to “even out” the ripples in B — this is called shimming Susceptibility • Susceptibility Artifact • -occurs near junctions between air and tissue • sinuses, ear canals • -spins become dephased so quickly (quick T2*), no signal can be measured sinuses ear canals Susceptibility variations can also be seen around blood vessels where deoxyhemoglobin affects T2* in nearby tissue [5] Source: Robert Cox’s web slides Bolesław AUGUSTYNIAKfMRI
Hemoglobin Source: http://wsrv.clas.virginia.edu/~rjh9u/hemoglob.html, Jorge Jovicich Hemoglogin (Hgb): - four globin chains - each globin chain contains a heme group - at center of each heme group is an iron atom (Fe) - each heme group can attach an oxygen atom (O2) - oxy-Hgb (four O2) is diamagnetic no B effects - deoxy-Hgb is paramagnetic if [deoxy-Hgb] local B Bolesław AUGUSTYNIAKfMRI
BOLD signal Blood Oxygen Level Dependent signal • neural activity blood flow oxyhemoglobin T2* MR signal Mxy Signal Mo sin T2* task T2* control Stask S Scontrol time TEoptimum Source: fMRIB Brief Introduction to fMRI Source: Jorge Jovicich [5] Bolesław AUGUSTYNIAKfMRI
BOLD signal [5] Bolesław AUGUSTYNIAKfMRI Source: Doug Noll’s primer
Hemodynamic Response Function • % signal change • = (point – baseline)/baseline • usually 0.5-3% • initial dip • -more focal and potentially a better measure • -somewhat elusive so far, not everyone can find it • time to rise • signal begins to rise soon after stimulus begins • time to peak • signal peaks 4-6 sec after stimulus begins • post stimulus undershoot • signal suppressed after stimulation ends Bolesław AUGUSTYNIAKfMRI [5]
fMRI Activation Flickering Checkerboard OFF (60 s) - ON (60 s) -OFF (60 s) - ON (60 s) - OFF (60 s) Brain Activity Time Source: Kwong et al., 1992 Bolesław AUGUSTYNIAKfMRI [3]
... ~ 11+ min fMRI: simple signal detection overview extract voxel or ROI timecourse… … and compare to protocol fMRI Signal (% change) Rest (c1) voxel or ROI time course t … protocol c2 … Auditory (c2) c1 t time … … [2] Bolesław AUGUSTYNIAKfMRI
fMRI Experiment Stages: Prep • 1) Prepare subject • Consent form • Safety screening • Instructions and practice trials if appropriate • 2) Shimming • putting body in magnetic field makes it non-uniform • adjust 3 orthogonal weak magnets to make magnetic field as homogenous as possible • 3) Sagittals • Take images along the midline to use to plan slices In this example, these are the functional slices we want: 12 slices x 6 mm Bolesław AUGUSTYNIAKfMRI [3]
fMRI Experiment Stages: Anatomicals • 4) Take anatomical (T1) images • high-resolution images (e.g., 0.75 x 0.75 x 3.0 mm) • 3D data: 3 spatial dimensions, sampled at one point in time • 64 anatomical slices takes ~4 minutes 64 slices x 3 mm Bolesław AUGUSTYNIAKfMRI [3]
VOXEL (Volumetric Pixel) Slice Thickness e.g., 6 mm In-plane resolution e.g., 192 mm / 64 = 3 mm 3 mm 6 mm SAGITTAL SLICE IN-PLANE SLICE 3 mm Number of Slices e.g., 10 Matrix Size e.g., 64 x 64 Field of View (FOV) e.g., 19.2 cm Slice Terminology [3] Bolesław AUGUSTYNIAKfMRI
fMRI Experiment Stages: Functionals • 5) Take functional (T2*) images • images are indirectly related to neural activity • usually low resolution images (3 x 3 x 6 mm) • all slices at one time = a volume (sometimes also called an image) • sample many volumes (time points) (e.g., 1 volume every 2 seconds for 136 volumes = 272 sec = 4:32) • 4D data: 3 spatial, 1 temporal … [3] Bolesław AUGUSTYNIAKfMRI
Anatomic Slices Corresponding to Functional Slices Bolesław AUGUSTYNIAKfMRI [3]
Time Courses Arbitrary signal varies from voxel to voxel, day to day, subject to subject MR SIGNAL (ARBITRARY UNITS) TIME To make the y-axis more meaningful, we usually convert the signal into units of % change: 100*(x - baseline)/baseline Changes are typically in the order of 0.5-4 %. MR SIGNAL (% Change) Bolesław AUGUSTYNIAKfMRI [3]
ROI Time Course fMRI Signal (% change) ~2s Condition Time Condition 1 Statistical Map superimposed on anatomical MRI image Condition 2 ... Region of interest (ROI) ~ 5 min Functional images Activation Statistics Time Bolesław AUGUSTYNIAKfMRI [3]
Use stat maps to pick regions Then extract the time course Statistical Maps & Time Courses [3] Bolesław AUGUSTYNIAKfMRI
2D 3D Bolesław AUGUSTYNIAKfMRI
BOLD Correlations Local Field Potentials (LFP) • reflect post-synaptic potentials • similar to what EEG (ERPs) and MEG measure Multi-Unit Activity (MUA) • reflects action potentials • similar to what most electrophysiology measures Logothetis et al. (2001) • combined BOLD fMRI and electrophysiological recordings • found thatBOLD activity is more closely related to LFPs than MUA Source: Logothetis et al., 2001, Nature Bolesław AUGUSTYNIAKfMRI
Comparing Electrophysiolgy and BOLD Data Source: Disbrow et al., 2000, PNAS Figure Source, Huettel, Song & McCarthy, Functional Magnetic Resonance Imaging Bolesław AUGUSTYNIAKfMRI
Verb generation after 15 min practice Verb generation fMRI Measures the Population Activity • population activity depends on • how active the neurons are • how many neurons are active • manipulations that change the activity of many neurons a little have a show bigger activation differences than manipulations that change the activation of a few neurons a lot • attention • activity • learning • activity • fMRI may not match single neuron physiology results Raichle & Posner, Images of Mind cover image Ideas from: Scannell & Young, 1999, Proc Biol Sci Bolesław AUGUSTYNIAKfMRI
Aparatura fMRI Bolesław AUGUSTYNIAKfMRI
fMRI schemat aparatury Bolesław AUGUSTYNIAKfMRI [2]
Necessary Equipment 4T magnet RF Coil gradient coil (inside) Magnet Gradient Coil RF Coil Source for Photos: Joe Gati [3] Bolesław AUGUSTYNIAKfMRI
Przykłady zastosowania Bolesław AUGUSTYNIAKfMRI
1. Symulacje... Fig. 1. (A) Source and electrode configuration. A cortical current density source model was used in the inverse problem. Five dipoles with unitary strength andoutward normal direction to the cortical surface were sampled randomly and used in the forward problem. (B) Scalp potentials were simulated at SNRZ5. (C) Cortical current density (CCD) distribution estimated by lead-field normalized weighted minimum norm approach, (D and G) The simulated fMRI activation map with one or two fMRI missing source(s), marked by the blue-dotted circle(s). The fMRI activations have fixed spherical extent with 1 cm radius. (E and H) CCD reconstruction using 90% fMRI-weighted Wiener estimation. (F and I) CCD reconstruction using Twomey algorithm. Clinical Neurophysiology 117 (2006) 1610–1622, Effects of fMRI–EEG mismatches in cortical current density estimation integrating fMRI and EEG: A simulation study Bolesław AUGUSTYNIAKfMRI
2. Category-Specific Visual Areas objects faces Malach, 2002, TICS • Parahippocampal Place Area (PPA) • place-selective • places > (objects and faces) • places > scrambled images places • Lateral Occipital (LO) • object-selective • objects > (faces & scenes) • objects > scrambled images • Fusiform Face Area (FFA) or pFs • face-selective • faces > (objects & scenes) • faces > scrambled images • ~ posterior fusiform sulcus (pFs) [3] Bolesław AUGUSTYNIAKfMRI
A Simple Experiment: LO Localizer Blank Screen • Lateral Occipital Complex • responds when subject views objects Intact Objects Scrambled Objects TIME One volume (12 slices) every 2 seconds for 272 seconds (4 minutes, 32 seconds) Condition changes every 16 seconds (8 volumes) [3] Bolesław AUGUSTYNIAKfMRI
4. Mózg szczura [6] Fig. 2. BOLD and BV-weighted fMRI in sagittal slices. Illustrative data from one animal. The coronal anatomical image (A) and the axial anatomical image (B) show the localization of four sagittal slices (outlined by red lines) for fMRI studies. Noxious stimulation-induced BOLD (C) and BV-weighted fMRI data (D) were obtained before (BOLD) and after (BV-weighted) injection of USPIO and are displayed as relative signal changes. Positive ΔS/S changes (red/yellow) are observed in BOLD fMRI, indicating an increase in venous oxygenation level, while negative ΔS/S changes (blue/violet) are detected in BV-weighted fMRI, indicating an increase in spinal blood volume. For both BOLD and BV-weighted fMRI, activations were mainly observed in the ipsilateral slice (slice No. 3). Green lines outline the surface of spinal cord in panel C and overlaid in panel D. Two horizontal yellow lines indicate the positions of disk between T13 and T12 (top) and disk between L1 and L2 (bottom). D: dorsal; M: medial; R: rostral; V: ventral Bolesław AUGUSTYNIAKfMRI
Wady i zalety Bolesław AUGUSTYNIAKfMRI
large vessels produce BOLD activation further from the true site of activation than small vessels (especially problematic for high-resolution fMRI) • large vessels line the sulci and make it hard to tell which bank of a sulcus the activity arises from • the % signal change in large vessels can be considerably higher than in small vessels (e.g., 10% vs. 2%) • activation in large vessels occurs later than in small ones • vessel artifacts are worse with gradient echo sequences (compared to asymmetric spin echo for example) and low field strengths Why are vessels a problem? [3] Bolesław AUGUSTYNIAKfMRI Source: Ono et al., 1990, Atlas of the Cerebral Sulci
Don’t Trust Sinus Activity • You will sometimes see bogus “activity” in the sagittal sinus [3] Bolesław AUGUSTYNIAKfMRI
More Caveats • “brain vs. vein” debate • source of signal affects spatial resolution • scientists haven’t agreed on a single theory to explain the relationship between oxygen, glucose metabolism and blood flow • no one really understands how neurons trigger increased blood flow • neural synchrony may be a factor [3] Bolesław AUGUSTYNIAKfMRI
Bottom Line • Despite all the caveats, questions and concerns, BOLD imaging is well-correlated with results from other methods • BOLD imaging can resolve activation at a fairly small scale (e.g., retinotopic mapping) • PSPs and action potentials are correlated so either way, it’s getting at something meaningful • even if BOLD activation doesn’t correlate completely with electrophysiology, that doesn’t mean it’s wrong • may be picking up other processing info (e.g., PSPs, synchrony) [3] Bolesław AUGUSTYNIAKfMRI
Conclusion: BOLD Signals for fMRI The BOLD signal is dependent on Bo, TE, pulse sequence (GE vs SE); vessel size, orientation, and density; venous oxygenation and volume changes -> Quantification of fMRI responses as a meaningful physiological parameter is difficult -> Difficulty to compare across subjects, especially with abnormal vascular conditions [5] Bolesław AUGUSTYNIAKfMRI
Źródła [1] http://psychology.uwo.ca/fMRI4Newbies/Tutorials/01%20Intro/Introduction.ppt [2] http://www.na-mic.org/Wiki/images/f/f4/NAMICfMRIintro.ppt [3] http://psychology.uwo.ca/fMRI4Newbies/Tutorials/01%20Intro/Introduction.ppt [4] http://kc.vanderbilt.edu/quant/Seminar/RogersFMRI.ppt [5] http://www.mntp.pitt.edu/Workshop/MNTP_res_2008/MNTP_fMRI_history_Kim.ppt [6] NeuroImage 40 (2008) 133–147 Bolesław AUGUSTYNIAKfMRI