Download
1 / 29
290 likes | 443 Views
Note: This presentation accompanied the Keynote Address by Dr. Tourangeau at the 2013 Federal Committee on Statistical Methodology Research Conference, Nov. 4, 2013. Confronting the Challenges of Household Surveys by Mixing Modes. Roger Tourangeau, Westat. Outline.

E N D
Note: This presentation accompanied the Keynote Address by Dr. Tourangeau at the 2013 Federal Committee on Statistical Methodology Research Conference, Nov. 4, 2013 Confronting the Challenges of Household Surveys by Mixing Modes Roger Tourangeau, Westat
Outline • Why mix modes of data collection? • Types of MM Designs • Five Issues with MM Designs • Assessing mode effects • Impact of choice • Impact of order • Getting responses via the Internet • “Unimode” versus best practices • Conclusions Presentation to the FCSM Research Conference November 4, 2013
Why Mix Modes? • Improve coverage • Increase response rates • Reduce costs • Improve measurement? Presentation to the FCSM Research Conference November 4, 2013
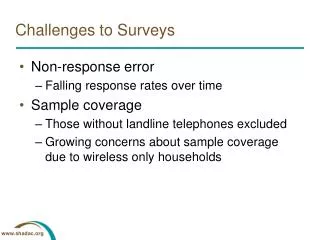
Why Mix Modes—II? • Costs are rising and response rates falling • Response rate problems found not just in government, but also in academic and commercial surveys (Tourangeau and Plewes, 2013) • Polls often have response rates in the single digits Presentation to the FCSM Research Conference November 4, 2013
Sample Adult Nonresponse in NHIS (Brick and Williams, 2013) Presentation to the FCSM Research Conference November 4, 2013
Sample Adult Nonresponse in NHES(Brick and Williams, 2013) Presentation to the FCSM Research Conference November 4, 2013
Costs and Return Rates: Decennial Census Presentation to the FCSM Research Conference November 4, 2013
Can Mixing Modes Help? Four common designs: • Cross-sectional mixed modes: Start with cheapest mode and follow up with more expensive modes to reduce NR bias; sometimes concurrent choice • American Community Survey (mail, CATI, CAPI) • U.S. population census, since 1969 (mail, FTF) • Canadian census (mail/Internet, FTF) • Different modes for different sections (NSFG) • Longitudinal mixed modes: Start with high RR mode, then follow-up waves done more cheaply • Current Population Survey—FTF with maximum telephone in Waves 2-4, 6-9) • Cross-national surveys: Use different modes in different countries Presentation to the FCSM Research Conference November 4, 2013
Five Issues Raised by MM Designs • Assessing mode effects: How do you tell whether the mode affects the measurement? • Impact of choice: Is it useful to let people choose their method responding? • Impact of order: If a sequential design is used, does the order of the options matter? • Getting responses via the Internet: How can one get responses in Web surveys? Can one get responses via the Web? • “Unimode” versus best practices: Should one minimize differences across mode? Presentation to the FCSM Research Conference November 4, 2013
Mode Effects • Is a mode effect a form of error? • Tourangeau, Conrad, and Couper (2013): No mode effects per se; two components contribute to mode differences • Differential non-observation error: Who responds? • Differential observation (measurement) error: What answers do they give? • Estimate from mode A reflects three ingredients: • the mean true score among the respondents to the survey in that mode () • the systematic impact of the mode of data collection on the answers () • and the average random error under that mode () • Mode effect: Net effect of non-observation and measurement error differences by mode Presentation to the FCSM Research Conference November 4, 2013
Non-Observation Errors • Impact of non-observation (non-coverage/non-response) for Mode A • Two components—those excluded entirely and those who might respond with different propensities Presentation to the FCSM Research Conference November 4, 2013
Non-Observation Effects--II • Two modes ought to increase coverage, reduce non-response relative to one mode • Consider the proportions with no chance of responding • The hope is that the mixed mode design likely to reduce the size of the excluded population as well as boosting mean response propensities Presentation to the FCSM Research Conference November 4, 2013
Observation Errors • Overall level of measurement error, depends on average measurement effect in both modes: • Whether the quantity above is larger or smaller than the measurement error in the corresponding estimate from a single-mode survey depends on • the relative magnitudes of errors in two modes, • whether they are in same or the opposite directions. Presentation to the FCSM Research Conference November 4, 2013
Issue 1: Assessing Mode Effects • Three common designs • Mode experiments • With true scores (Tourangeau, Groves, and Redline, 2010; Kreuter, Presser, and Tourangeau, 2008) • Without true scores (Tourangeau and Smith, 1996) • Mixed mode design compared with single-mode design (Vannieuwenhuyze and Loosveldt, 2012; Vannieuwenhuyze, Loosveldt, Molenberghs, 2010) • Experimental design—B with A follow-up versus A only • Assume coverage/nonresponse the same in two conditions • A respondents would give same answers regardless of whether they had B option • First assumption not very plausible (look at ESS data, Dutch experiment) Presentation to the FCSM Research Conference November 4, 2013
Vannieuwenhuyze and colleagues (2010, 2012) • Two components (non-observation and observation error) may offset • Advocate design that compares B then A versus A only • Survey about surveys in the Netherlands • Measurement and nonresponse effects offset each (FTF-only vs. mail with FTF) • People who dislike surveys less likely to respond to mail • People less like to report negative attitudes in FTF • Different conclusions about mode effect unless FTF only included in analysis Presentation to the FCSM Research Conference November 4, 2013
Tourangeau, Groves, and Redline (2010) • Sample of Maryland residents who are registered to vote; sample stratified by voter status • Alternative strategy: • Experimentally varied mode • Have true scores (from frame on key variables) • Response rates (overall 34%) reflect incentive (44% vs. 23%) and voter status (41% vs. 26%) Presentation to the FCSM Research Conference November 4, 2013
Bias Estimates Estimated Percentage of Voters in 2006 Presentation to the FCSM Research Conference November 4, 2013
Issue 2: Impact of Choice • In cross-sectional design: Should you give people a choice? At first blush, it would seem to encourage higher response rates; let people respond by the mode they prefer • ACS experiment (Griffin, Fischer, and Morgan, 2001) showed lower response rate for mail with Internet option than mail-only • Medway and Fulton (2012): Examine 19 experiments comparing Web + mail versus mail only • Choice lowers RR by 3.8 percent on average • Only 10.2 percent use Web Presentation to the FCSM Research Conference November 4, 2013
Choice (cont’d) • Medway and Fulton did not examine two large ACS experiments • ACS 2011 test (Tancreto et al., 2012): No impact of choice per se Presentation to the FCSM Research Conference November 4, 2013
Choice (cont’d) • If you want people to respond by the cheaper mode, why give them a choice? • Does the order of modes matter? Presentation to the FCSM Research Conference November 4, 2013
Issue 3: Sequence of Modes • Having refused by one mode, are they more likely to refuse in a second mode? • Lynn (2013): Offering low propensity/low cost mode first may lower overall RR • Messer and Dillman (in Washington State): Mail followed by Web higher RR than Web followed by mail • Holmberg, Lorenc, and Warner (2010): Web followed by mail nearly as high as mail only, but 65 percent complete by mail • Olson, Smyth, and Wood (2012): Web followed by mail no different from mail followed by web • ACS tests in 2011 suggest that sequence not so crucial (see also Matthews et al., 2012) Presentation to the FCSM Research Conference November 4, 2013
Issue 4: Getting Responses via the Web • Can you get people to respond via the Web? • The 2011 Canadian experience (Dolson, 2013) • Experiment in mail-out areas (80 percent of total population) • 75 percent get letter, 25 percent mailed questionnaire • The majority of Canadians responded by the Internet (53 + percent) • Four mailings: Prenotification, reminder letter, mail questionnaire, voice reminder Presentation to the FCSM Research Conference November 4, 2013
Getting Responses via the Web (cont’d) • Mag (2013): Hungarian experience • Three lessons • Don’t give people a choice • Don’t let them procrastinate • Give them an incentive Presentation to the FCSM Research Conference November 4, 2013
Issue 5: Unimode versus Best Practices • Should one try to remove mode effects (measurement effects by design) or attempt to reduce measurement effects within each mode group? • Two issues relevant here: • Is the estimate an overall population estimate or an estimated difference across groups? • Does the estimate involve an attitudinal or factual variable? Presentation to the FCSM Research Conference November 4, 2013
Overall Estimates • Combined estimate from MM survey: • Minimize error in overall estimate by minimizing measurement error (not by maximizing comparability) Presentation to the FCSM Research Conference November 4, 2013
Making Comparisons • Minimize difference in mode effects • Use the same mode of data collection to collect within each population (e.g., satisfaction ratings from patients at two hospitals) • If more than one mode were used to collect the data (say, a combination of web and mail), then use the same mix of modes in each population (at each hospital) • Third, if neither the same mode nor same mix of modes can be used, then use the unimode approach (designing the questions to minimize mode differences) • Differences often in attitudinal variables Presentation to the FCSM Research Conference November 4, 2013
Conclusions 1) Mode differences are not themselves a form of error Instead, mode differences reflect differences in coverage/nonresponse and differences in measurement errors 2) Some danger that offering a choice can lower response rates • Don’t give concurrent choice • Push people to the cheapest option 3) With a cross-section survey, it seems possible that refusing in one mode increases likelihood of refusal in second mode Presentation to the FCSM Research Conference November 4, 2013
Conclusions (cont’d) 4) People will respond by the Web—Don’t give them a choice, do multiple follow-ups • Minimize error, not mode differences • With factual items and overall estimates, use the best methods in each mode • With comparisons, especially comparisons involving attitudinal judgments (such as satisfaction ratings), reduce mode differences • Use single mode, • Use same mix of modes • Use unimode design Presentation to the FCSM Research Conference November 4, 2013
Thank you! RogerTourangeau@Westat.Com Presentation to the FCSM Research Conference November 4, 2013