Download
1 / 10
100 likes | 283 Views
Force, Speed & Motion Test Review. Feb 12, 2013. Make Sure you know:. How to calculate average speed S= D ÷ T Know the 13 vocabulary words on the orange sheet (the test we took last week) Know how to read a graph

E N D
Force, Speed & Motion Test Review Feb 12, 2013
Make Sure you know: • How to calculate average speed S= D ÷ T • Know the 13 vocabulary words on the orange sheet (the test we took last week) • Know how to read a graph • Know that velocity is just like average speed, just add directions: for example: • Speed= 45 m/sec • Velocity= 45 m/sec, West
Horizontal • Vertical • If there is a horizontal line showing on a graph with DISTANCE VS TIME, it is representing an object that is not moving at all. Distance Time
Remember if there’s a graph with SPEED VS TIME, and the speed of an object does not change, the object is traveling at a constant speed. Speed Time
Warm Up:The following is showing the distance traveled by a swimmer over time. What is the distance that the swimmer swam the last 2 minutes?
When you know only distance and time only, you can find speed • When you know distance and time (speed) and DIRECTION, you can find velocity
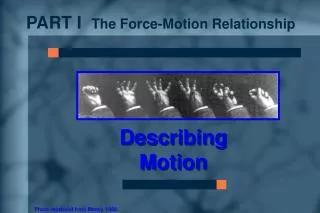
Distance Vs Time • Graphing distance and time on a graph shows the objects motion • The steepness of a slope on graph shows how quick or slow an object is moving • Which car is moving the fastest? • Which car is moving the slowest?
Incline Planes • Increasing the length of a ramp on an inclined plane, makes the work done on it easier to do • Example: • If the guy in the picture had a longer ramp to push the furniture on it, the work would be much easier.