Exploring Co-Variation in Box Problem
Dive into the Box Problem by identifying varying quantities, exploring co-variation with formulas and graphs, and finding maximum volume. Focus on meanings in formulas and multiple representations.

Exploring Co-Variation in Box Problem
E N D
Presentation Transcript
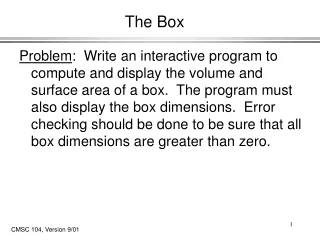
The Box Problem Identifying and Reasoning with Variation and Co-Variation
8.5” 11” NET BOX • Using scissors and tape, create a box by cutting equally sized squares from each corner. • Measure the dimensions of the box. • Label all quantities on the net and on the box.
8.5” 11” Discussion • How are the boxes different? • What quantities vary? • What quantities remain constant?
Exploring Co-Variation • GSP • VPython program • Finger Tool
Exploring Co-Variation • What are the “Landmarks” of the variation? • Make a numerical table for cut-out size and volume on Fathom • What important points are observed from the table?
Exploring Co-Variation • Extend the numerical table • Developing formulas in meaningful ways
Exploring Co-Variation with Formulas • Enter the formulas in fathom. • Enter values for x. • Create a graph of the data points. • Create a graph of the function V(x).
Exploring Co-Variation with Formulas V(x) = x (11 – 2x)(8 – 2x) • Identify “Landmarks” on the graph. • Interpret their significance in the context of the problem.
Part 1 Summary • Conceptual focus on Quantities • Emphasis on Co-Variation • Variation in each quantity • Some form of interdependence • Development of Multiple Representations Context, Finger Tool, Numbers, Table, Formulas, Graph (data and function) • Focus on Meaning in formulas • Starting with concrete and building to the abstract • Generalizing the arithmetic process • Corresponding to observable relationships in the context
Maximum Volume • What is the shape of the box with the biggest volume? • What representations can we use to find the maximum volume and how? • Whiteboard your method in a way that makes each step clear.
? = Different Boxes… Same Volume? • Find another box with the same volume as the box that your group created? • Whiteboard your method including as many representations as possible.
Amounts of Change • What features of co-variation do you notice when using the finger tool to examine the function L(x)? • What are the corresponding features in the table AND in the context? • V(x) is not straight. How is that fact related to the table of values AND to the context of the problem?
What Exactly Did We Do? • How is this problem usually presented to students in textbooks? • How is what you did similar or different from that?
Amounts of ChangeandRate of Change An illustration from the Box Problem: V(x) is not straight. How is that fact related to the table of values AND to the context of the problem? • Describe this in terms of rate of change. • Describe this in terms of amounts of change.
A Puzzle about Area & Slope Slope at origin = 93.5 in2 Area = 93.5 in2 8.5 in 11 in
A Second Puzzle about Area Maximum Volume Box Area of Sides ≈ 41.723 in2 Area of Base ≈ 41.723 in2
Box Problem - Part 1 Summary • Conceptual focus on Quantities • Emphasis on Co-Variation • Variation in each quantity • Some form of interdependence • Development of Multiple Representations Context, Finger Tool, Numbers, Table, Formulas, Graph (data and function) • Focus on Meaning in formulas • Starting with concrete and building to the abstract • Generalizing the arithmetic process • Corresponding to observable relationships in the context
Box Problem - Part 2 Summary • Different representations evoke different ways of reasoning. • Translation between representations encourages speaking in meaning and reinforces concepts. • Algebraic representations are not always the most powerful. • Asking questions which require students to reverse the function process reinforces concepts.