Download
1 / 33
330 likes | 471 Views
Summary of Lecture 1. Introduction to Earth’s atmosphere origin composition structure comparison with other planets Stefan’s law. Solar and Terrestrial Radiation. Sun ~ 6000 K UV/vis l max ~0.6 m m Solar flux =1370 Wm -2 S (1- a ) /4= s T E 4 Earth ~ 255 K IR l max ~ 12 m m.

E N D
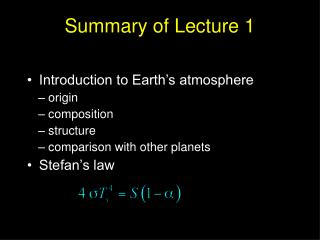
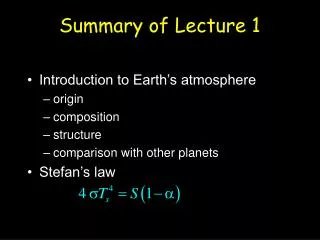
Summary of Lecture 1 • Introduction to Earth’s atmosphere • origin • composition • structure • comparison with other planets • Stefan’s law
Solar and Terrestrial Radiation Sun ~ 6000 K UV/vis lmax~0.6mm Solar flux =1370 Wm-2 S (1-a)/4=sTE4 Earth ~ 255 K IR lmax~ 12mm
DUV UVb UVa / Visible InfraRed UVc UV absorption
Notes: • Surface has Ts=288 K and radiates sTs4 = 400 Wm-2(117 units). • Atmosphere at 250 K radiates 220 Wm-2 (64 units), both up and down. • 30% of surface radiation is reflected by the atmosphere (32 units), giving a total downward flux of 96 units. • Non-radiative flux of 100 Wm-2 (30 units) drives the atmospheric circulation and weather
Global Climate Net short, long and global radiation entering and leaving the top of our atmosphere measured by satellite. Data are from the Earth Radiation Budget Experiment (ERBE)
JFM 2002 is clearly the warmest ever Temperature rise °C Global temperatures 1860-2001
Change in extent of Arctic sea ice Arctic sea ice extent, million km2
700 600 500 400 350 Carbon dioxide concentration in the atmosphere, due to three emissions scenarios Business as usual emissions Constant 1990 emissions 50% reduction in emissions CO2 concentration ppm
Global temperature rise IPCC A1FI emissions A2 emissions B2 emissions B1 emissions Global temperature rise, degrees C
Hadley Centre Components of sea-level rise
Met Office / Hadley Centre A1FI emissions scenario 0 1 2 3 4 5 6 Pattern of annual temperature changes2080s relative to present day
winter summer Hadley Centre Hadley Centre °C Temperature rise Medium-high emissions scenario, 2080s
Met Office / Hadley Centre A1FI emissions scenario – 3 – 2 – 1 – 0.5 – 0.25 0 0.25 0.5 1 2 3 Pattern of annual precipitation changes2080s relative to present day
Medium-high emissions scenario, 2080s winter summer Hadley Centre Hadley Centre Change in precipitation %
Change in surface temperature with forced THC collapse, but without change in greenhouse gases Hadley Centre Deg C
Carbon Cycle photosynthesis respiration
Predicted temperature rise Assuming current levels of CO2 emission