Download
1 / 53
530 likes | 646 Views
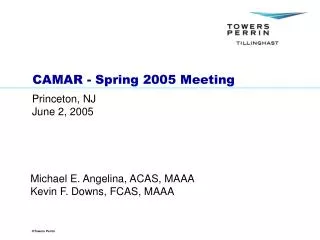
Michael E. Angelina, ACAS, MAAA Kevin F. Downs, FCAS, MAAA. CAMAR - Spring 2005 Meeting. Princeton, NJ June 2, 2005. Agenda. Concerns in the Current System Quantification of Liabilities Potential Solutions. Concerns in the Current System (1).

E N D
Michael E. Angelina, ACAS, MAAA Kevin F. Downs, FCAS, MAAA CAMAR - Spring 2005 Meeting Princeton, NJ June 2, 2005
Agenda • Concerns in the Current System • Quantification of Liabilities • Potential Solutions
Concerns in the Current System (1) • Plaintiffs should demonstrate injury to file a claim • The number of claim filings has increased dramatically • 2003 claim filings against the Manville Trust exceeded 100,000 • Fewer than 10% of claims are malignant • Per RAND, ⅔ to ¾ are unimpaired • The right to seek recovery if/when an injury manifests should not be limited • Each claim should stand on its own merit • Restrictions on mass consolidations • Venue should be controlled • Avoid forum shopping in “magic jurisdictions”
Surge in Claim Filings • 2004 Manville Trust Claim Filings: 14,500 • 2005 Manville Trust Claim Filings: 9,300 at May 2005; 22,320 annualized Note: Excludes Non-U.S. claims
100 MD Other states 80 TX 60 Percent IL NJ OH 40 MS PA WV 20 NY CA 0 Evidence of Forum Shopping Source: RAND, January 2003
Increasing Numbers of Claimants Are Unimpaired 1982 4% of claims showed no manifest asbestos-related injury(RAND) 1993 Up to one-half of all asbestos claims have little or no physical impairment (Harvard Journal of Legislation) 1998 No evidence of disease in 57% of asbestos claims(Manville Trust) 74% of pending claims are unimpaired(confidential report prepared for a defendant) Two-thirds of claims show no evidence of impairment(Babcock & Wilcox) Vast majority of claims provide no evidence of impairment(W.R. Grace) 2001 Source: RAND
Concerns in the Current System (2) • A low percentage of total payments have reached the claimants. Per RAND: • 30% - defense transaction costs • 29% - plaintiff attorney fees and legal costs • 41% - to claimants • Resources are limited • 77 defendant companies have sought bankruptcy protection • But defendant pool has increased to ~8,400 • Future sick may not be compensated
Number of Asbestos Related Bankruptciesper Year While only five bankruptcy petitions were filed during each of 2003 and 2004, the reduced level should not be misinterpreted as a sign of improvement in the asbestos litigation crisis. Rather, the number of 2003-2004 petitions was likely lower as defendants delayed decisions as they awaited the outcome of federal reform efforts. Note: Graph excludes a bankruptcy in 1976.
Differences Between Traditional and Pre-Packaged Bankruptcies Traditional Pre-Packaged • Can take years to complete1 • File petition • Negotiate with creditors • File reorganization plan • File disclosure statement • Solicit votes • Confirmation hearing • Intended to be completed within a few months of filing • Negotiated and voted on before filing • Combined hearing to confirm plan and disclosure • Insurance coverage generally exhausted or settled, or insurers included in negotiations • Insurers interests are not represented in pre-petition negotiations • Court appoints claimant representatives • Future’s Rep involved in negotiation for >50% equity • Commonly include a pre-petition trust to pay near full value on current claims • Plaintiff attorneys with large inventories negotiate matrix agreements that benefit their own clients, but do not owe a duty to all claimants • Disease criteria broadly defined • Claimants not fully compensated, so remain eligible to vote on the bankruptcy plan • Generous awards to lower disease severity classes • Significant portion of equity can be secured (therefore not available to bankruptcy trust) 1 Johns Manville filed bankruptcy in 1982 and its plan was not confirmed until 1988; Babcock & Wilcox filed bankruptcy in 2000 and its plan has not yet been confirmed.
Problems with Pre-Packaged Bankruptcies • Negotiated in secret by a select group of lawyers, whose clients receive preferential treatment relative to other claimants with similar disease • Future’s Representative bound by pre-petition settlements • Debtor is negotiating with insurers’ money • Conflicts of interest are abundant Source: Mark D. Plevin/Crowell & Moring LLP
Independence vs. Conflicts of Interest? • From appointment of Kenesis (5/2002) until pre-package bankruptcy filed (9/16/2003), AC&S settled more than $2 billion of claims • Settlements over prior 20 years totaled $600 million • Pre-packaged plan stipulated that these settlements could not be challenged by the asbestos trust or AC&S AC&S • AC&S’ counsel for pre-packaged bankruptcy • Also negotiating AC&S claim settlements GHR Joseph Rice/Ness Motley Pre-petition Committee 70% Ownership • “Independent” claim reviewer • Paid $3M to review documentation of 250,000 Category D claimants • Purchased Clearing House in June 2003 Kenesis Pre-petitionTrust – Categories A, Bx, By, C, D ClearingHouse • Paid $2M as subcontractor of Kenesis • Sole proprietor, J. Benee Wallace, paralegal of Ness Motley
AC&S Plan Denied Confirmation • On 1/23/04 Judge Newsome (Delaware federal bankruptcy court) denied confirmation of the AC&S pre-packaged bankruptcy plan, finding that the plan • Was not proposed in good faith • Unjustly prejudiced by plaintiff attorneys • Largely drafted by and for the benefit of the pre-petition committee through various pre-petition settlements • Unfairly favors one plaintiff over another • Fundamentally unfair that one claimant with non-symptomatic pleural plaques will be paid in full, while someone with mesothelioma runs the substantial risk of receiving nothing • Both should be compensated based on the nature of their injuries, not based on the influence and cunning of their lawyers “The court is informed that other judges have confirmed plans with such discriminatory classifications. This judge cannot do so in good conscience.”
How to Quantify Asbestos Liabilities? • Many use benchmarks or rules of thumb • Market share techniques • For example, 5% of GL premium volume for affected years translates to 5% share of ultimate liabilities • Survival ratio techniques • equals ratio of total reserves divided by average annual payments • U.S. net asbestos survival ratio at year-ends 2001, 2002, 2003 = 8.8, 11.4, 10.6, respectively • A.M. Best using an undiscounted survival ratio of 18 - 20. • Aggregate development • multiples of paid losses, case reserves, or reported losses • Comparisons to peer companies (e.g., significant reserve additions)
How to Quantify Asbestos Liabilities? • Exposure-based modeling will improve understanding of ultimate A&E liabilities • For an insurer or reinsurer, it considers • Mix of insureds • Types of coverage • Policy wording • Attachment points and limits • Years of coverage • Claims handling and settlement activities • Greater understanding equips the defendant, insurer, or reinsurer to deal strategically with its exposure
Asbestos Insurer/ReinsurerExposure-Based Analysis Steps: (1) Identification of exposure to asbestos defendants (2) Projection of ground-up ultimate loss and expense for known asbestos defendants (3) Allocation of defendant losses across coverage block • Comparison of losses in a given year to insurer / reinsurer coverage terms • Provision for non-products losses • Provision property damage, DJ expense • Provision for “pure” IBNR • Ceded / net analysis • Provision for uncertainty
Asbestos Insurer/ReinsurerExposure-Based Analysis The Types of Asbestos Defendants
Exposure-Based Analysis:(1) Identification of Exposure to Asbestos Defendants • List all asbestos claims / notices • Identify all coverage issued to major asbestos defendants • Review non-asbestos claims/notices • Search of underwriting records for direct coverage and facultative reinsurance • Cedent audits for reinsurers’ treaty business • Review coverage profiles of major defendants to identify cedent involvement and potential reinsurer treaty coverage • Research corporate genealogy • Identify producers of “at risk” products
Exposure-Based Analysis:(1) Identification of Exposure to Asbestos Defendants • Practical Issues: • “Missing” coverage • Unknown coverage terms • Exclusions in underlying policies • Reinsurer attachment relative to first dollar • Potential reinsurer benefit from client’s inuring facultative coverage
Exposure-Based Analysis:(2) Projection of Ultimate Ground-Up Loss and Expense for an Asbestos Defendant • Frequency / severity projection • Project future claim filings • Select average indemnity and future trend • Estimate expense load • Special considerations • Coverage exhaustion / settlements • Bankruptcies • Changing litigation profile of the defendant • Incremental v. cumulative experience • Changes in mix of claims by disease and state
Exposure-Based Analysis:(2) Projection of Ultimate Ground-Up Loss and Expense for an Asbestos Defendant • Transaction costs have consumed more than half of total spending and are likely to increase in the future • No formal joint defense mechanisms remain (e.g., ACF, CCR) • “Settlement” philosophy hasn’t worked • Newer defendants • Discovery costs (product, coverage) • “Fight or die”
Exposure-Based Analysis:(3) Allocation of Defendant Losses Across Coverage Block • Allocate ground-up ultimate indemnity and expense to year • Compare to available coverage • Reflect expense treatment (varies by policy) • Consider coverage disputes, choice of law • Consider other erosion of products aggregate limits • Consider reinsurance cessions to estimate net losses
Excess 2 Excess 110%InsurerABC Excess 120%InsurerDEF Excess 170%InsurerGHI Primary - Insurer JKL Exposure-Based Analysis:(4) Comparison of Losses to Coverage Terms • Example: More detailed coverage description of Excess 1 Layer in 1980
Exposure-Based Analysis:(4) Comparison of Losses to Coverage Terms • Example: Comparison of Losses in a Given Year to Insurer / Reinsurer Coverage Terms • If Insurer ABC wrote 10% of $5 million xs of $1 million in 1980, and ultimate losses allocated to 1980 totaled • $1,000,000, then Insurer ABC’s gross liability would be $0 • $4,000,000, then Insurer ABC’s gross liability would be $300,000 (= 10% x ($4,000,000 – $1,000,000)) • $6 million, then Insurer ABC’s gross liability would exhaust its limit of $500,000
Exposure-Based Analysis:(5) Provision for Non-Products Losses • Non-products losses without products exposure • Most often premises related • For most, absence of aggregate limits has no impact • Non-products losses by traditional products defendants • A limited number of traditional products defendants have been successful in bringing non-products claims • Attorneys are clever • Generally due to exhausted products coverage • “Reclassify” claims to reinstate products limits • File operations claims to access additional coverage, generally written without aggregate limits • Aggregate limits may be imposed • Wellington • Bankruptcy negotiations • Settlements
Exposure-Based Analysis:(6) Provision for Property Damage, DJ Expense • Significant property damage liability experienced by only a few defendants • DJ Expenses • Consider ratios of paid DJ/paid loss & ALAE • Consider DJ reserves • Consider recent DJ payment levels and future multiples • Consider (changes in) staffing levels
Exposure-Based Analysis:(7) Provision for Pure IBNR • Emergence of additional exposure arising from additional coverage / new defendants • Estimate annual emergence • Estimate future reporting horizon and rate of decline • Consider severity of new exposure • Adverse development on known accounts • Uncertainty with newer risks • Coverage identification / ”missing” policies • Discovery of liability potential / immature litigation
Exposure-Based Analysis:(8) Ceded/Net Analysis • Best practice: directly reflect terms of outward reinsurance protections applied to gross loss estimates • Model gross, ceded and net directly • However, some outward programs are too disparate / complicated to model • Some insurers can provide gross estimates to ceded reinsurance department • Common practice: review historical net / gross ratios by homogenous groupings • Paid ratios may not be reflective of future • May be distorted by a few large accounts • May not adequately reflect future cessions in excess-of-loss programs • Consider reinsurance collectibility: commutations, insolvencies, disputes
Exposure-Based Analysis:(9) Provision for Uncertainty • Range of estimates considers various scenarios / uncertainty • Why have projections missed the mark in the past? • Choice of methods • Data constraints • Specific assumptions • External environment • Unimpaired claimants • Mass screenings • Impact on settlements / compensation • Dismissals • Inactive dockets • “Jackpot” awards • Bankruptcy • Pre-packs • Accelerated payments • Expansion of “target” defendant list • Reform efforts
Portion of $200 billion Ultimate Loss and Expense – Retained, Net Insured U.S., Net Non-U.S.** *$60 billion mid-point of $55 – $65 billion range of the “Universe” of net liabilities to the U.S. P/C market. **Additional details available in Emphasis 2001/3, “Sizing Up Asbestos Exposure,” a publication of Tillinghast – Towers Perrin, at www.towers.com.
Paid and Reported Loss and Expense Compared to Estimates of Net U.S. Ultimate Liability
Recognition of Asbestos Liabilities Based on Note 29 Annual Statement data as of 12/31/2002 and public disclosures of reserve charges during 2003. *Note, for some companies 2003 gross (or ceded) amounts were not disclosed, so only the net amount is included.
Recent Increases in U.S. Asbestos Liabilities • U.S. Insurers have increased asbestos reserves by at least $12 billion gross ($8 billion net) since the beginning of 2003 • The Hartford – $4.0B gross, $2.6B net (May 2003) • Travelers - $3.2B gross, $2.6B net (Jan 2003) • ACE USA - $2.2B gross, $0.3B net A&E (Jan 2003) • Swiss Re America - $520M gross, $458M net (Q4 2003) • CNA - $517M net A&E (Q3 2003) • Allstate - $514M net (Q2&Q3 2003) • AIG - $440-450M net (Q4 2003) • Liberty Mutual - $405M gross, $331M net (Q3 2003) • Chubb $250M net (Q4 2003) • Argonaut - $52.8m (Mar 2003) • Follows further significant increases in 2001 and 2002 • Increased pressure on peers to make similar disclosures
Recent Increases Abroad • Equitas (amounts in Sterling) • £1.5B gross undiscounted (Q1 2000) • £1.7B gross undiscounted (Q1 2001) • No change as of Q1 2002 • £0.4B gross discounted (Q1 2003) • £0.3B gross discounted (Q1 2004) • Royal & Sun Alliance (amounts in Sterling) • £371M for U.S. and U.K. (Feb. 2002) • £150M for U.S. and U.K. (Sept. 2003) • £500M for U.S. and U.K. (March 2004)
Themes Underlying Insurer/Reinsurer Charges • Some companies recognized increases each year, others less frequently • Not all insurers included in the “dirty thirty” have increased reserves by a significant amount • Increases in anticipated cessions exceed increases in net amounts recognized by reinsurers • Some reinsurance is non-U.S.
Comparisons of Reserve Adequacy • Need an understanding of the method(s) utilized • Prior to 2002 insurer disclosures • Guesswork • Rules of thumb • Disclosures during 2003 • Provided first details regarding ground-up exposure-based analyses • Specific assumptions underlying the actual analyses are critical and many details are still not disclosed
Manville Trust Recent Claim History • The Manville 2002 TDP is almost exactly the same as the TDPs in emerging and pending asbestos trusts • From October 1, 2003 through March 31, 2005, a period of 18 months, the CRMC received approximately 28,000 Manville Trust claims • In the first 9 months of 2003, the CRMC received approximately 90,000 Manville Trust claims • Why such a dramatic decrease in claim filings? Source: David Austern, CRMC, April 6, 2005 ACI Meeting
2002 Revised Manville Trust Distribution Process (TDP) • The 2002 Manville TDP differs from the 1995 TDP in the following ways • There is a requirement of Significant Occupational Exposure (“SOE”) • There is more stringent medical criteria under the 2002 TDP • An independent claims forecaster re-evaluated claims filed between 2000 and 2003 under the 1995 TDP to determine how the claims would have been settled if they had been filed pursuant to the 2002 TDP • Expected annual claim payments decreased from (estimated) $146.8 million to $87.9 million • Only one-third of the 1995 TDP claims filed in three of the major claim categories met the SOE requirement • A significant number of claims failed to meet the more stringent 2002 medical criteria • Approximately 50% of the 1995 TDP claims were paid at the lowest compensable value; when 2002 TDP criteria were employed, nearly 84% of the claims were paid at the lowest compensable value Source: David Austern, CRMC, April 6, 2005 ACI Meeting
What Are Potential Federal Solutions? Asbestos-Related Bills Introduced into the 108th (2003-2004) Congress: • 6 relating to asbestos reform • HR1114 – Kirk (R-IL) – office of Asb. Comp./court • HR1586 – Cannon (R-UT) – court • HR1737 – Dooley (D-CA) – court • S413 – Nickels (R-OK) – court • S1125 / S2290 – Hatch (R-UT) – trust • 2 to ban the use of asbestos • HR2277 – Waxman (D-CA) • S1115 – Murray (D-WA) • 1 to change the tax code, such that asbestos-related settlement funds would be exempt from tax • HR2503 – Collins (R-GA)
Senate Bill 1125 • Introduced May 2003 • No Fault System • Initially called for a privately funded trust totaling $108 billion comprised of: • Insurers - $45B • Defendant companies - $45B • Current bankruptcy - $4B • Voluntary contributions - $14B • Funding contribution • Insurers still negotiating; subject to insurer commission • Defendants grouped to tiers based on historical payments • Separated into sub-tiers based on revenues
Potential Insurer Allocation • Insurers include U.S. and Non-U.S. companies • Insurer funding is net of third party reinsurance • Gross of financial cover • Initial discussions based on a blended approach • Market share – premium and paid losses • Future exposure – carried reserves • More recent discussions focused on an industry-wide ground-up study • Insurer funding is concentrated • 12 insurers likely to contribute 75% • 20 insurers likely to contribute 90%
Initial Quantification of the Economic Impactof S1125 – 6/4/2003 Hearing • Is proposed Trust Fund of $108B adequate? • Tillinghast Projections Released May 2001: • $200B Ultimate Loss & Expense • Less $70B paid as of 12/31/2002 (est. by RAND) • Equals $130B of 2003+ future payments • Reduced for frictional costs • $61B expected to reach claimants • Conclusion is consistent with RAND: transaction costs have consumed more than half of total spending
Initial Quantification of the Economic Impactof S1125 – 6/4/2003 Hearing • Reflect specific indemnity awards under S1125 • Future claims to be be filed from 2003 - 2049 • Pending claims to be re-filed • Initially eight Disease Levels consistent with the Manville 2002 TDP • Specific awards by Disease Level • $0 for Levels I-II to • $750,000 for Level VIII (meso) • Tested various scenarios - all at or below $108B
Senate Bill 1125 - 2003 Compromises • S1125 passed out Senate Judiciary Committee on July 10, 2003 (10-8) with significant compromises • Revised medical criteria – 10 Disease Levels • Revised awards ($20,000 for Level II to $1 million for Level X) • Department of Labor to process claims • Unresolved issues: • Size of the fund • Start-up / pending claims • Finality / sunset provisions
Progression of Trust Fund (S1125 / S2290) • S2290 was an updated version of S1125 • Introduced April 7, 2004 • Frist funding - $124B • Specter process agreements • Administrative structure • Expedited start-up • Expedited judicial review • Modified sunset • Moratorium • Return to federal court
Outcome of S2290 • 4/22/2004 – Senate did not obtain 60 votes needed to invoke cloture for debate before the full Senate • 50 Yea / 47 Nay • 5/6/2004 – Further negotiations mediated by Chief Judge Emeritus Edward Becker of the Third Circuit U.S. Court of Appeals ended without agreement • Defendants / Insurers offer $116B + $12B contingency = $128B • Demand by AFL-CIO remains at $134B + $15B contingency = $149B • However, Frist / Daschle continued to work toward a compromise
Potential Size of the Fund • Compensation levels and projections of claim filings • April 2004 CBO estimate = $140B over 50 years • Daschle late-June proposal of $141B(+$4B from existing trusts = $145B) • Frist mid-July proposal of $140B(=$136B + $4B from existing bankruptcy trusts) • September 2004 compromise reached at $140B • NPV differs by ~$4B • Demand by AFL-CIO remains at $149B • Insurers remain at 2003 offer of $46B
Most Significant Outstanding Issues of S2290 • Start -Up • Daschle would allow most cases with a trial date to proceed in court • Frist would have all existing claims revert to the fund, except where there has been a final judgment • Lung cancer claims • Level VII: $500K Daschle v. $150K Frist • No finality • Reversion to state and federal courts
Efforts in the 109th (2005-2006) Congress • President Busch campaigns for asbestos reform • Trips/speeches in Detroit and Madison County • State of the Union • Specter holds Judiciary Committee HearingJanuary 11, 2005 • Discussion draft released January 7, 2005 with “blanks” • Exxon Mobil, DuPont, Federal Mogul and others say they would fare better under existing system • AIA says draft bill “designed to fail” • Group of insurers / defendants say draft “raises serious concerns”
Efforts in the 109th (2005-2006) Congress • February 2, 2005 Hearing regarding mixed-dust claims and “double-dipping” • Medical experts agreed asbestos v. silica disease can be distinguished • Unlikely an individual would suffer diseases carried by both substances • Early-February Specter delays introduction of bill to garner GOP support, at request of Frist • Late February, describes process as balancing act between Democrats and Republicans, but making progress • March 1, Washington Times “If everyone insists on the last bit of advantage, there will be no bill… Prompt compromises will have to be forthcoming if this critical legislation is to become law or relegated to the deep freeze.” • Frist has reserved time in early April (after 3/18 – 4/4 recess) for Senate consideration • S. Res 43 (H. Reid/Democrat/Nevada) designates April 1, 2005 as “National Asbestos Awareness Day”