Download
1 / 7
70 likes | 177 Views
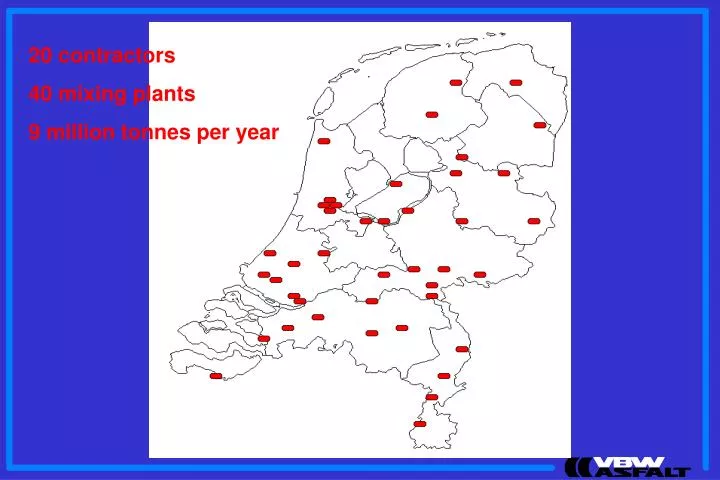
20 contractors 40 mixing plants 9 million tonnes per year. Topics Promoting application of asphalt Technical specs and regulations Technical Committee Environmental policy and regulations Committee on Environment. Technical specs and regulations European harmonisation CE-marking

E N D
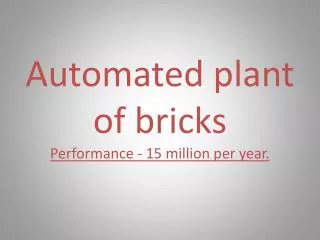
20 contractors 40 mixing plants 9 million tonnes per year
Topics • Promoting application of asphalt • Technical specs and regulations • Technical Committee • Environmental policy and regulations • Committee on Environment
Technical specs and regulations • European harmonisation • CE-marking • Introduction • of functional specifications • Marshall properties
Environmental policy and regulations • Energy consumption mixing plants • Emissions and ETS • Recycling • Dangerous Substances • Life Cycle Analyses • Green procurement • Warm Asphalt
Long term aggreement on • Energy efficiency • Since 1995 • New program 2005 – 2020 • Goal: 2% per year improvement energy eff. • Every mixing plant: 4 year program • 2013 - 2016 • Yearly monitoring • Energy management system
350 340 330 320 310 MJ / ton asfalt 300 290 280 270 260 250 1998 2000 2001 2002 2003 2004 2005 2006 2007 2008 2009 2010 2011 sector average Trend variatie SEV 1998-2011 voor de sector = -1,6% per jaar Trend variatie SEV 1998-2011 voor de Top 6 = +0,2% per jaar TOP 6