Download

1 / 45
450 likes | 550 Views
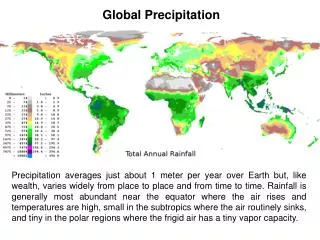
Adjustment of Global Gridded Precipitation for Systematic Bias. Jennifer Adam Department of Civil and Environmental Engineering University of Washington. Motivation. Systematic bias results in a net underestimation of precipitation

E N D
Adjustment of Global Gridded Precipitation for Systematic Bias Jennifer Adam Department of Civil and Environmental Engineering University of Washington
Motivation • Systematic bias results in a net underestimation of precipitation • Most global precipitation products are not adjusted for systematic bias • Model runs forced with unadjusted precipitation estimates will not accurately perform a water balance
Wind-Induced Undercatch • Influencing Factors: • Wind speed • Temperature • Gauge type • Gauge height • Windshield • Exposure Nespor and Sevruk, 1999
Precipitation Gauges of the World • ~50 types of National Standard gauges Sevruk et al., 1989
1998 World Meteorological Organization (WMO) Solid Precipitation Measurement Intercomparison (Goodison et al. 1998) • Goals: • Introduce reference method for gauge calibration • Derive standard method to adjust for wind-induced solid precipitation undercatch CATCH RATIO (CR) = Measured Precipitation True Precipitation
Objective • To improve gridded precipitation data used to force large-scale hydrology models
Methodology Overview • Create mean monthly “catch ratios” gridded ½˚ by ½˚ globally • Apply to existing gridded precipitation products (time-series or climatologies) during the period of 1979 through 1998
Step 1: Selection of Correction Domain • Wind-Induced Solid Precipitation Undercatch: • Countries that experience >½ of precipitation as snow during the coldest month of the year. • 30 countries in the Northern Hemisphere were selected • Wind-Induced Liquid Precipitation Undercatch: Worldwide • Wetting Losses: Worldwide
Step 2: Choose Meteorological Stations • NOAA CPC Summary of day Stations (NCAR) • 1994 through 1998 daily data • Coincident P, Tmax, Tmin, Wind Speed measurements • 7,878 stations were used (4,647 for snow analysis)
Step 3: Wind-Induced Solid Precipitation Undercatch + • Apply on a daily basis • Assume gauge type and height per country
Step 4: Wind-Induced Liquid Precipitation Undercatch (Legates, 1987) • e.g. κr = 1.0 + 0.011 μ2 whp2 • Apply on a monthly basis + Step 5: Wetting Losses (Legates, 1987) • Assume one measurement per day at each station • 0.02 < ΔPwr< 0.30 mm/day • ΔPws = ½ ΔPwr
Step 6: Apply Bias Adjustment Model Liquid + Solid
Step 7: Determine Mean Monthly Catch Ratios for each station Mean Monthly Observed Mean Monthly Adjusted Step 8: Interpolate Catch Ratios to ½ ° x ½ ° globally Step 9: Apply to an existing Gridded Precipitation Product
Canada • Unique Precipitation Gauge Network • Liquid Precipitation: AES Type B • Solid Precipitation: ~125 Nipher Gauges ~2500 Snow Ruler Stations • Previous Bias Adjustment Efforts over Canada • Groisman (1998) • Mekis and Hogg (1999)
6,692 stations • Monthly analysis • Assumed CR = 90% • 495 stations • Daily analysis • Utilized WMO Results
Groisman ÷ Mekis and Hogg (1979 – 1990) • Ratios applied to Groisman station data • Mean Monthly Catch Ratios calculated
Gridded Catch Ratios Catch Ratio (%)
Adjusted Gridded Precipitation • Catch Ratios Applied to Willmott and Matsuura (2001) Monthly Time-Series from 1979 through 1998 Precipitation (mm/month)
Adjustment Effects Wind-Induced Snow All Adjustments • Global Mean Annual Increase of 11.2% Undercatch Wind-Induced Rain Undercatch Wetting Losses
Summary • Adjusts existing gridded precipitation products for wind-induced undercatch and wetting losses on a mean monthly basis • Effort focused on snow-dominated regions and solid precipitation undercatch • Utilizes the recent WMO Solid Precipitation Measurement Intercomparison results
Acknowledgements:Dennis Lettenmaier, Steve Burges, Bart Nijssen and the Land Surface Hydrology Research Group Supported by NASA grant NAG5-9416 to the University of Washington.
Wind-Induced Undercatch • Gauge Representation • Gauge type or shield uniform over country • Gauge height uniform, wind sensor height at 10 m • Regression Equation Application • N and r2 • Equation developed for what gauge?
Comparison Against Yang et al. • Greenland: Yang 2.5% lower (wind sensor height, rain undercatch eqn.) • Siberia: Yang 1.6% lower (rain undercatch eqn.) • Alaska: Yang 3.5% lower (shielding,gauge height, wind sensor height, rain undercatch eqn.)
Legates (1987) Global Precipitation Product • ½° by ½° monthly precipitation 1920-1980 climatology (global land areas) • Accounts for: • Wind-Induced Undercatch (Liquid and Solid) • Wetting Losses • Evaporation Losses • Adjustments determined from mean monthly meteorological data
WMO Intercomparison Results • Determined Catch Ratio (CR) Regression Equations for the most common National Standard Precipitation Gauges • Hellmann, US NWS 8”, Tretyakov, Nipher, others CATCH RATIO (CR) = Measured Precipitation True Precipitation • Accounts for Wind-Induced Undercatch of Soliid Precipitation
Double-Fenced International Reference (DFIR) • Encloses the Shielded Tretyakov Gauge UCAR
Wetting Losses • Influencing Factors: • Gauge type • Climate • Measurement Methodology
Evaporation Losses • Influencing Factors: • Gauge type • Climate • Measurement Methodology
Adjusted Precipitation Gauge-Measured Precipitation Wind-Induced Undercatch Evaporation Losses Wetting Losses Sevruk, 1982
Liquid + Solid Legates, 1987
+ • Evaporation Losses Ignored
Overview of Project • Create mean monthly “catch ratios” gridded ½˚ by ½˚ globally • Apply to existing gridded precipitation products (time-series or climatologies) during the period of 1979 through 1998