Visualization with VisIt Part II
350 likes | 541 Views
Lawrence Livermore National Laboratory. Visualization with VisIt Part II. Brad Whitlock. This work performed under the auspices of the U.S. Department of Energy by Lawrence Livermore National Laboratory under Contract DE-AC52-07NA27344. Organization and Schedule. Data Comparison

Visualization with VisIt Part II
E N D
Presentation Transcript
Lawrence Livermore National Laboratory Visualization with VisItPart II Brad Whitlock This work performed under the auspices of the U.S. Department of Energy by Lawrence Livermore National Laboratory under Contract DE-AC52-07NA27344.
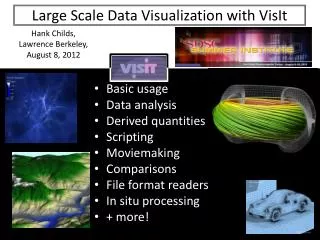
Organization and Schedule • Data Comparison • Python Scripting • Plots, Selections, and Exporting • More Data Analysis
Lesson Goals By the end of this lesson you will be familiar with working with multiple databases at the same time and you will know how to compare multiple databases • Time slider • Multiple time sliders • Disconnecting plots from the time slider • Database correlations • CMFE expressions • Automatic time expressions • Data Level Comparison Wizard
Time Sliders • You can navigate through time using time sliders • Each time-varying database gets its own time slider • You may choose between time sliders to change time for each database independently
Disconnecting Plots From the Time Slider • Sometimes you may want to show a plot from one time step while you view other plots from different time steps • You can disconnect a plot from the time slider using the plot menu’s context menu
Database Correlations • A database correlation is a map that relates one or more different time-varying databases • Database correlations tie different databases to a new time slider that controls all of the databases in the database correlation • Create database correlations using the Database Correlation window
Database Correlation Window • Create new database correlations • Edit existing database correlations • Control automatic database correlation settings • By default, VisIt will try to create a database correlation when you add a plot of a database that has the same number of states as another database
Data Level Comparison Wizard • Simplifies the setup needed to compare fields that exist on different meshes • Compare fields from different time steps in the same database • Compare fields from 2 different databases • Generates CMFE expressions
Lesson Goals By the end of this lesson, you will have experimented with some of VisIt’s more complicated Python scripting capabilities • Python overview • Using Python with VisIt • Macros window • Python callbacks
Python Overview • Python is a powerful interpreted scripting language • VisIt has exposed its plotting commands as a Python module so that Python scripts can be used to drive VisIt • Useful for movie generation in batch • Useful for automated data analysis
Python Callback Functions • Each action in VisIt has an associated command with arguments that is sent from the VisIt client to the VisIt viewer where the commands are processed • It is possible to register functions that get called whenever specific commands are processed • Lets you attach custom behavior to actions you may take when driving VisIt
Lesson Goals • Spreadsheet plot • Parallel Coordinates Plot • Data Selections • Exporting Data
Spreadsheet Plot • Spreadsheet plot opens a new window that lets you inspect data in spreadsheet form • One domain at a time • Shows slice representation in vis window • The plot is the new window • Select spreadsheet cells • Sum • Average • Export to text file • Use this plot with scalar values
Parallel Coordinates Plot • Examine relationship between several variables • Draw line from cell to cell in each axis • Paths that are used by more cells are brighter • Restrict ranges on each axis • Use this plot with scalar variables
Selections Original data • A Selection is a mask that describes a reduced set of cells isolated from a plot • Selections can be applied to other plots, making it easy to look at different views of the data • Selections can be saved and loaded • The Selection window creates a selection from the active plot • Selections are applied to plots via the Subset window Selection mask Off On Selected data
Selection Example • A selection defined by the Parallel Coordinates plot isolates cells in the original mesh • As the selection changes, it can be applied to the plots that use it
Selection Controls Selection Window Subset Window
Exporting Data • VisIt can save the data from a plot to a new database using Export database • Exporting a database saves all of the data that was used to generate the plot • This includes internal data that is normally removed by the face list filter before rendering • You might want to use export database if you plan to: • Save results of a complex calculation so you can reuse the results without having to recalculate • Analyze some VisIt data in another application
Lesson Goals This section introduces some of VisIt’s more powerful expressions, operators • Time Expressions • Connected Components • DeferExpression Operator • Data Binning Operator • Python Filters
Time Expressions • Time iteration expressions • Calculate the maximum, minimum, average value at a location over time • Calculate the time when a condition occurs (e.g. time when the maximum value at a location occurs and return the time as the value on the mesh)
DeferExpression Operator • Expression evaluation in VisIt typically happens immediately after the data are read and before any data are passed into operators and plots • Sometimes you want to defer certain expressions from being evaluated until later • Such as when you change the data using an operator and then want the expressions to operate on the modified data • Example: • Using a Transform operator combined with expressions to do coordinate system transformations
Connected Components • The Connected Components functionality in VisIt scans the mesh and tags all independent chunks • Useful for grouping sets of cells into larger pieces that you can then analyze further • Connected Components is available 3 ways • Expressions • Operator • Query
Data Binning Operator • The Data Binning operator lets you relate multiple variables as different dimensions and then bin them into multidimensional histograms which are then operated on to produce the field that we visualize
Python Filters Parallel engine • Write new expressions and queries in Python • Enter Python expressions into the Expression window’s Python tab • Manipulate VTK data objects directly Data source User-defined Python expression Expression filter Python Filter Filter
Support and Contact Information • Contact us at visit-users@email.ornl.govif you have questions • Visit us on the Web at http://www.llnl.gov/visit • User Community Wiki at http://www.visitusers.org • User Community Forum at http://www.visitusers.org/forum/forum.pl • Online Bug Tracker at http://visitbugs.ornl.gov