Download
1 / 22
220 likes | 392 Views
Measurements of oxygenated volatile organic compounds by remote sensing techniques. WMO/GAW VOC experts workshop Geneva, January 2006. Outline. Method and Instruments Selected results from ground-based and satellite measurements

E N D
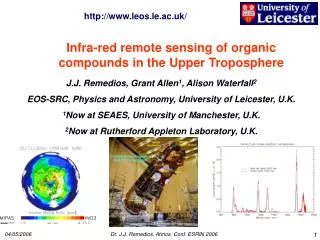
Measurements of oxygenated volatile organic compounds by remote sensing techniques WMO/GAW VOC experts workshopGeneva, January 2006
Outline • Method and Instruments • Selected results from ground-based and satellite measurements • Comparison of satellite measurements with model results (LMDz-INCA) for HCHO • First results from CHOCHO satellite retrieval • Conclusions
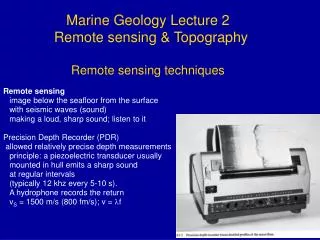
HCHO and CHOCHO measurements Detection: • UV/vis measurement of scattered sunlight (Nadir from space / Multi-axis from the ground) • Method: Differential Optical Absorption Spectroscopy - DOAS • Result: averaged absorption along all contributing light paths Retrieval: • Selection / correction for clouds • Correction for vertical sensitivity (airmass factors) depending on several meteorological parameters • Optimal Estimation for profile retrieval from ground Results: • Tropospheric Vertical Columns (VC) from space • VC and profile information from the ground-based observations
From space GOME and SCIAMACHY satellite instruments spatial resolution320x40 km2 (GOME) and 60x30 km2 (SCIAMACHY) global coverage within 3 (GOME) and 6 (SCIAMACHY) days From ground MAX-DOAS Bremian DOAS Network for Atmospheric Measurements (BREDOM) In operation: Ny Ålesund (79°N, 12°E) Bremen (53°N, 9°E) Merida (8°N, 71°W) Nairobi (1°S, 37°E) Temporary in operation: Summit (72°N, 38°W) Andoya (69°N, 16°E) Zugspitze (47°N, 10°E) Alzate (46°N, 9°E) Cabauw (52°N, 5°E) Instruments for VOC observations presented here UV/vis
Data available at iup Bremen • global data set for HCHO since July 1995 from GOME (until March 2003) and SCIAMACHY (since January 2003) • data quality of SCIAMACHY HCHO somewhat reduced compared to GOME due to instrumental characteristics, but better spatial resolution • global data set for CHOCHO since July 2004 from SCIAMACHY (analysis for data since 2003 still ongoing) • ground-based data from several stations between 79°N and 1°S Data sets are available on request tofolkard@iup.physik.uni-bremen.de , the full GOME data set will be available on the RETRO project website (http://retro.enes.org)
HCHO vs. Land Cover Black rectangles indicate „Regions of Interest“ used for comparison with model
GOME vs. Model Correlation 0.89 and slope 0.63 above continents, 0.83 and 1.02 above oceans
Model vs. GOME Model run 33: mean biomass burning, run 34: annual variation of biomass burning
Conclusions • continuous nadir VC measurements of HCHO since 1995, data provided as monthly means for GOME or 3-month means for SCIAMACHY • ground-based observations yield valuable profile information for data interpretation and satellite validation • first validation for HCHO and CHOCHO reasonable • comparison with model results excellent in terms of pattern above continents, but: • large discrepancies above e.g. South America in magnitude • seasonal variation different above source regions in Africa • higher values from satellite above several water bodies – long range transport from HCHO precursors or oceanic sources?
Conclusions (Part 2) • first global observations of glyoxal • similar pattern than formaldehyde • ratio between HCHO and CHOCHO about 20 to 1 above source regions (e.g. biomass burning) • again high values of glyoxal above some water bodiesspectral interference to liquid water or chlorophyll absorption? biogenic sources?
Outlook • further validation with ground-based or airborne observations (in situ, AMAX- and MAX-DOAS), more data from source regions and above remote areas (e.g. oceans) necessary • combined use of several UV/vis satellites for diurnal variation (different overpass times!) • investigate ratio of HCHO/CHOCHO for different source regions • include CHOCHO in model studies