Excel chapter 4
Excel chapter 4. Nitin Chowdary Are Nitin.are@mail.wvu.edu. charts. Basics. Chart is a visual representation of numerical data. Data point is a numerical value that describes a single value on a chart. Data series is a group of related data points.


Excel chapter 4
E N D
Presentation Transcript
Excel chapter 4 Nitin Chowdary Are Nitin.are@mail.wvu.edu
Basics • Chart is a visual representation of numerical data. • Data point is a numerical value that describes a single value on a chart. • Data series is a group of related data points. • Category Label is text that describes a collection of data points in a chart.
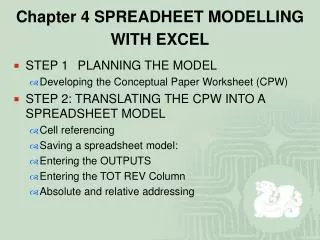
Decide which chart type to create • Variety of charts are available • Column chart • Clustered column chart • Stacked column chart • Bar chart • Line chart • Pie chart • Other types: Area chart, Scatter chart, Stock chart, Surface chart, Doughnut chart, Bubble chart, Radar chart,
1. Create a simple column chart • Column chart displays data comparisons vertically in columns. • Chart areacontains entire chart and all of its elements. • Plot area contains graphical representation values in a data series. • X-axis (category axis) is the horizontal line, provides descriptive group names for subdividing the data series. • Y-axis (Value axis) is the vertical line, displays incremental values to identify the values of the data series.
Create a simple column chart • Open ‘majors’ Excel file • Select E4:E12 • Insert Tab -> Column chart • You can change the properties of chart using several option in LAYOUT ribbon after selecting a particular chart.
2. Clustered column chart • Groups or clusters similar data in columns to compare values across categories. • Open majors excel sheet and select A4:F11 and create a clustered column chart. • Legend is a key that identifies color, gradient, picture, texture, or pattern fill assigned to each data series in a chart.
3. Stacked column chart • Places stacks of data in segments on top of each other in one column, with each category in the data series represented by a different color. • Select cells and insert Stacked column chart. • Right click on chart and select “Select Data” and click “ Switch row/columns ”
4. Bar chart • Bar chart compares values across categories using horizontal bars. • Width of the bar indicates its value. • Create Bar chart for majors worksheet.
5. Line chart • Line chart uses a line to connect data points in order to show trends over a period of time. • Different color for each data series.
6. Pie chart • Pie chart shows each data point in proportion to the whole data series as a slice in a circular pie. • An exploded pie chart separates one or more pie slices from the rest of the pie chart. • Create a pie chart for 2012 • *Use Ctrl to select 2012 column
Explode a pie slice • Click on pie chart • Click on particular slice and drag it.
Managing charts • Chart Design • Chart Layout • Chart Format
Chart design • Move a chart • Select and drag it (with in the sheet) • Use move chart option under design ribbon ( new sheet ) • Chart Styles • Chart Layout • Data ( Select data, Switch row/column) • Type ( change chart type, Save as template) • Print a chart
Chart layout • Insert • Labels • Axis • Background • Analysis • Properties
Chart format • Shape styles • Word styles • Arrange • Size