Download
1 / 7
70 likes | 82 Views
Learn about population studies, samples, case studies, surveys, sampling art, error analysis, and overcoming biases in data analysis. Explore different sampling methods and how to conduct effective research using case studies and surveys. Understand the complexities in statistical analysis and how to ensure the accuracy and reliability of your findings.

E N D
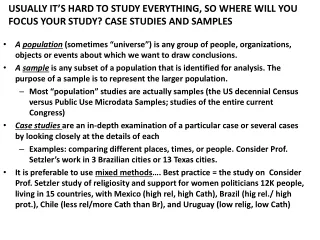
USUALLY IT’S HARD TO STUDY EVERYTHING, SO WHERE WILL YOU FOCUS YOUR STUDY? CASE STUDIES AND SAMPLES • A population (sometimes “universe”) is any group of people, organizations, objects or events about which we want to draw conclusions. • A sample is any subset of a population that is identified for analysis. The purpose of a sample is to represent the larger population. • Most “population” studies are actually samples (the US decennial Census versus Public Use Microdata Samples; studies of the entire current Congress) • Case studiesare an in-depth examination of a particular case or several cases by looking closely at the details of each • Examples: comparing different places, times, or people. Consider Prof. Setzler’s work in 3 Brazilian cities or 13 Texas cities. • It is preferable to use mixed methods…. Best practice = the study on Consider Prof. Setzler study of religiosity and support for women politicians 12K people, living in 15 countries, with Mexico (high rel, high Cath), Brazil (hig rel./ high prot.), Chile (less rel/more Cath than Br), and Uruguay (low relig, low Cath)
CASE STUDIES ARE USED WHEN QUANTITIATVE ANALYSIS ISN’T APPROPRIATE OR POSSIBLE • More on this next week, but for now, why wouldn’t you always want to use large samples of understand a phenomenon? • How do we select cases? • Picking “typical” cases of a political phenomenon at differ levels of your independent variable (Three cities in Brazil) • Anomalies (Why democracy in India?) • Most difficult cases (Why affirmative action in Texas?) • Using multiple case studies to “control” for variables • Most similar design (e.g., Canada vs. US) • Most different design (e.g. US vs. Iran and how we think about nuclear weapons)
SURVEYS AND THE ART OF SAMPLING • What is a random sample? Why is it fairly common to have a stratified (characteristics) or clustered (geography) sample? • What is the not very good alternative to ensure a representative sample? Quota samples • How do you draw a random sample? • Old school: Unorganized lists of names and randomly selected sampling interval (why did the Vietnam draft draw not work right?) • RDD (random digit dialing) or • Stratified random samples are most common: US Cong. Dist -> census tract-> household –>person • These days, the best surveys used mixed methods: landline, phone, Internet. How do you get a representative sample on the internet? • Because it is expensive and tedious to get samples, we often use panels now. There are some big plusses to these over time.
THE ART OF SAMPLING • Sampling error is present for all random samples • This is the statistically predictable polling error that comes from relying on a sample that is smaller than the whole population. It is a function of probability. The math behind this is covered in PSRM, chp. 7 • We generate “statistics” (e.g. means or medians) from samples to estimate “parameters” for the population • The larger the sample, the more confidence we can have that a statistic is close to what we would see in the population as a whole. • What’s the math behind the larger sample = more precise estimates? • The “Central Limit Theorem” (why the casino always wins the more you gamble) • “Normal distribution” (aka “bell curve): 36th, 84th, 95th, 99th percentiles • Probability of 4 heads in a row = .0625; of 7 in a row = .008 • “Confidence level” vs “confidence interval” (aka “the margin of error”). At a 95% confidence level (95% = 2 standard deviations): • A statistic for a sample of 100 observations has 95% confidence interval +/- 11% • At 500 observations it is +/- 5.5% • At 1000, it is +/- 4% • At 1500, it is +/- 3% (This is what social scientists aim for) • At 4000, it is +/- 2%
WHERE CAN THINGS GO WRONG AND WHAT TO DO ABOUT IT • Sampling bias • This is when your sample systematically deviates from the population • You have to make sure that you have a random draw of the population you want to look at: President Alf Landon? The 1936 Literary Digest Poll with 10 million ballots • A modern equivalent: pooling African-American or Latino subjects. • Convenience sampling (opt-in internet sampling like Amazon Turk or YouGov) • The emergence of push polling • Response rate issues (Cell phone vs. landline; young vs. old, type of workers), panel survey drop-off rates (the before + after pool can be quite a lot off) • How do we deal with sampling bias? • Pilot the survey and verify against known distributions (most commonly the census) to see if there’s a problem… but this is difficult with a specialized sample. • Pay folks who to do the survey if necessary. • Use post-hoc weighting if possible… But be careful (Setzler made certain types of Brazilians super meaningful in one of his recent studies because of population and survey weights) • Over-sample key groups and then weight
OTHER ISSUES Question wording, order, and response options matter Sometimes, we don’t want a representative sample:Purposeful sampling (i.e., non-probability sampling when you know you aren’t going to have a random sample) • Capturing all of the current population (i.e. a survey of US Congressional offices to look at responses to constituents with diff. types of last names) • Elite sampling • Snowball sampling
OTHER ISSUES What happened with the 2016 forecast? • It wasn’t as off as some suggest: Clinton won the natl. vote by the predicted margin. • Nate Silver was the most bullish on Trump, predicting a 20% chance of a win. Polling is about probability—This stuff happens all of the time: Trump won, and the Cubs came back from 3 games down, the Patriots came back from 25 pts. down in the third Q, and Leicester City came from nowhere to win the Premiere league • Special problems with vote choice questions: Who is a likely voter? (vs. everyone, vs registered voters) • Some polls didn’t include third party options (which varied by state) • Poll herding appears to have been an issue • Were Trump voters less likely to respond? It doesn’t look like that was a huge issue • Last minute movement and an unusually high number of undecided voters should have been a clear sign this election was very volatile. In this sense FBI director’s Comey’s letter was probably decisive. • Silver’s model better took into account the probability of an unknown shift b/c it considered previous elections going back to 1972 (remember, even the best basketball team loses games to a terrible team sometimes)… In other words, he knew that state polls miss with some frequency • Silver’s model better considered the idea that the polling being off in one state would likely be correlated to similar misses in similar states. I.e. if polling was off in PA, it was probably going to off in WI.