Download
1 / 40
400 likes | 490 Views
Planned Contrast: Execution (Conceptual) 1. Must predict pattern of interaction before gathering data. Predict that Democratic women will be most opposed to gun instruction in school, compared to Democratic men, Republican men, and Republican women. Post Hoc Tests

E N D
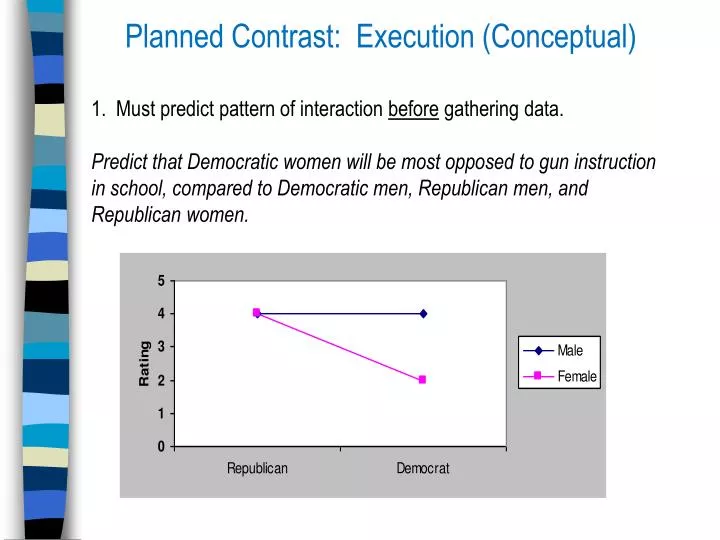
Planned Contrast: Execution (Conceptual) 1. Must predict pattern of interaction before gathering data. Predict that Democratic women will be most opposed to gun instruction in school, compared to Democratic men, Republican men, and Republican women.
Post Hoc Tests Do female democrats differ from other groups? 1 = Male/Republican 5.00 2 = Male/Democrat 4.50 3 = Female/Republican 4.75 4 = Female/Democrat 2.75 Conduct six t tests? NO. Why not? Will capitalizes on chance. Solution: Post hoc tests of multiple comparisons. Post hoc tests consider the inflated likelihood of Type I error Kent's favorite—Tukey test of multiple comparisons, which is the most generous. NOTE: Post hoc tests can be done on any multiple set of means, not only on planned contrasts.
Conducting Post Hoc Tests 1. Recode data from multiple factors into single factor, as per planned contrast. 2. Run oneway ANOVA statistic 3. Select "posthoc tests" option. Note: Not necessary to conduct planned contrast to conduct post-hoc test ONEWAY gunctrl BY genparty /CONTRAST= -1 -1 -1 3 /STATISTICS DESCRIPTIVES /MISSING ANALYSIS /POSTHOC = TUKEY ALPHA(.05). Selected post-hoc test
Data Management Issues Setting up data file Checking accuracy of data Disposition of data Why obsess on these details? Murphy's Law If something can go wrong, it will go wrong, and at the worst possible time. Errars Happin!
Creating a Coding Master 1. Get survey copy 2. Assign variable names 3. Assign variable values 4. Assign missing values 5. Proof master for accuracy 6. Make spare copy, keep in file drawer
Coding Master variable values variable names Note: Var. values not needed for scales
Cleaning Data Set 1. Exercise in delay of gratification 2. Purpose: Reduce random error 3. Improve power of inferential stats.
Complete Data Set Note: Are any cases missing data?
Checking Descriptives Are any “Minimums” too low? Are any “Maximums” too high? Do Ns indicate missing data? Do SDs indicate extreme outliers?
Checking Correlations Between Variables Do variables correlate in the expected manner?
Number of Siblings Gender Oldest Oldest Youngest Youngest Only Child Only Child None Males 10 4 10 3 6 20 Females One 3 5 4 15 20 0 More than one TOTAL 3 15 25 4 40 2 TOTAL 10 10 8 Using Cross Tabs to Check for Missing or Erroneous Data Entry Case A: Expect equal cell sizes Case B: Impossible outcome
Storing Data Raw Data 1. Hold raw data in secure place 2. File raw data by ID # 3. Hold raw date for at least 5 years post publication, per APA Automated Data 1. One pristine source, one working file, one syntax file 2. Back up, Back up, Back up ` 3. Use external hard drive as back-up for PC
21-40 41-60 61-80 81-100 101-120 File Raw Data Records By ID Number 01-20
COMMENT SYNTAX FILE GUN CONTROL STUDY SPRING 2007 COMMENT DATA MANAGEMENT IF (gender = 1 & party = 1) genparty = 1 . EXECUTE . IF (gender = 1 & party = 2) genparty = 2 . EXECUTE . IF (gender = 2 & party = 1) genparty = 3 . EXECUTE . IF (gender = 2 & party = 2) genparty = 4 . EXECUTE . COMMENT ANALYSES UNIANOVA gunctrl BY gender party /METHOD = SSTYPE(3) /INTERCEPT = INCLUDE /PRINT = DESCRIPTIVE /CRITERIA = ALPHA(.05) /DESIGN = gender party gender*party . ONEWAY gunctrl BY genparty /CONTRAST= -1 -1 -1 3 /STATISTICS DESCRIPTIVES /MISSING ANALYSIS /POSTHOC = TUKEY ALPHA(.05). Save Syntax File!!!
Research Project Notebook Purpose: All-in-one handy summary of research project Content: 1. Administrative (timeline, list of staff, etc.) 2. Overview of Research 3. Experiment Materials * Surveys * Consents, debriefings * Manipulations * Procedures summary/instructions 4. IRB materials * Application * Approval 5. Data * Coding forms * Syntax file * Primary outcomes
Correlation Class 20
Today's Class Covers What and why of measures of association Covariation Pearson's r correlation coefficient Partial Correlation Comparing two correlations Non-Parametric correlations
Do Variables Relate to One Another? Positive Is teacher pay related to performance? Is exercise related to illness? Is CO2 related to global warming? Is platoon cohesion related to PTSD? Is TV viewing related to shoe size? Negative Positive Negative Zero
Exercise and Illness 1. How many times a week do you exercise? _____ 2. How many days have you missed school this term due to illness? _____ 3. How many hours of sleep do you get each night? ____
Interpreting Correlations [C] Sleep Hours [A] Exercise [B] Illness A --> B Exercise reduces illness B --> C Illness reduces exercise C --> (A & B) Third variable (sleep) affects exercise and illness simultaneously
Scatterplot: Exercise and Days Sick Regression Line
Co-variation 8 7 6 5 4 3 2 1 0 exercise days sick days # Days Subject Number 1 2 3 4 5 6 7 8 9 10 11 12 13 14
Covariation Formula Σ (Xi – X) (Yi – Y) cov (x,y) = N – 1 (-3.32) + (0.40) + (-0.46) …+ (-1.02) cov(exercise, sickness) = 14-1 = -23/13 = -1.77
Problem with Covariation "To all health and exercise researchers: Please send us your exercise and health covariations." Team 1: exercise = days per week exercise, covariation = -1.77 Team 2: exercise = hours per week exercise, covariation = -34.00 What if we all we have are the covariations? How do we compare them? How would we know, in this case, whether Team 1 showed a larger, smaller, or equal covariation than did Team 2?
Σ (Xi – X) (Yi – Y) r = sxsy (N – 1) Pearson Correlation Coefficient covxy r = sxsy Pearson r (“rho”): -1.00 to + 1.00
Using R2 to Interpret Correlation R2 = r2 = amount of variance shared between correlated variables. Correl: exercise.hours, sick.days = .613 R2 = .6132 = .376 “About 38% of variability in sick days is explained by variability in exercise hours.”
Variation in Sick Days Explained by Exercise Hours R2 = .6132 = .376 Exercise hours = .376% 0 2.5 7 Number of Sick Days Last Term
Partial Correlation Issue: How much does Variable 1 explain Variable 2, AFTER accounting for the influence of Variable 3? Sickness and Exercise Study: How much does exercise explain days sick, AFTER accounting for the influence of nightly hours of sleep? Partial Correlation answers this question.
Partial Correlation Sick Days Exercise Days Sleep Hours var. explained = .376 var. explained by sleep alone (.17) var. explained = .277 var. explained by exercise + sleep (.21) var. explained by exercise alone (.04)
Partial Correlations in SPSS PARTIAL CORR /VARIABLES= sleep.hours exercise.days by sick.days /SIGNIFICANCE=TWOTAIL /MISSING=LISTWISE. PARTIAL CORR /VARIABLES= sleep.hours sick.days by exercise.days /SIGNIFICANCE=TWOTAIL /MISSING=LISTWISE.
Non-Parametric Correlations Assumptions of Correlations 1. Normally distributed data 2. Homogeneity of variance 3. Interval data (at least) What if Assumptions Not Met? Spearman's rho: Data are ordinal. Kendall's tau: Data are ordinal, but small sample, and many scores have the same ranking
Parametric Correlations Assumptions of Correlations 1. Normally distributed data 2. Homogeneity of variance 3. Interval data (at least) Watch TV 1 hr 2 hr 3 hr 4 hr 5 hr Eat Fast Food 1 day 2 day 3 day 4 day 5 day Var. A Var. B
Non-Parametric Correlations What if Assumptions Not Met? Spearman's rho: Data are ordinal. Kendall's tau: Data are ordinal, but small sample, and many scores have the same ranking. Watch TV Never Daily Weekly Monthly Yearly Eat Fast Food Never Daily Weekends Holidays Leap Years Var. A Var. B
Comparing Correlations Issue: How do we know if one correlation is different from another? Example: Is the nightly-sleep / sick days correl. different from the TV hours /sick days correl?
Difference Between Correlations Diff. Between 2 Independent correlations zr1 - zr2 z = 1 1 + n1 - 3 n2 - 3 Diff. Between 2 dependent = correlations (n-3) (1 + rxz) √ tdifference = (rxy - rzy) 2 (1-r2xy -r2xz - r2zy + 2rxyrxzrzy) Link to calculator for two ind. samples correlations http://faculty.vassar.edu/lowry/rdiff.html
Note: Assumes independent samples