Download
1 / 53
560 likes | 712 Views
Benchmarking Finance and Business Operations. The Finance and Administration Roundtable May 24, 2006. PRESENTERS. Bron Prokuski VP, Business Operations National Defense Industrial Association Nat Bartholomew, CPA Principal LarsonAllen. FRAME THE DAY. What is Benchmarking?

E N D
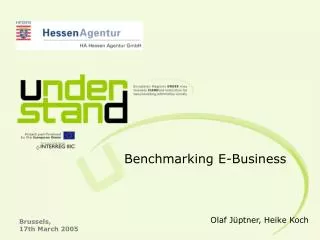
Benchmarking Finance and Business Operations The Finance and Administration Roundtable May 24, 2006
PRESENTERS • Bron Prokuski VP, Business Operations National Defense Industrial Association • Nat Bartholomew, CPA Principal LarsonAllen
FRAME THE DAY • What is Benchmarking? • Group Benchmarking Exercise • Sources of Benchmarking Data: • Sample Financial Benchmarks • Sample Policy Benchmarks • Demonstration on Use of Benchmarking Data
WHAT IS BENCHMARKING? • Comparison of like attributes or metrics from similar demographic data samples • People, process, technology, business processes/practices/strategies • A baseline for performance improvement • Opportunity to gain best practices • Measurement by fact rather than opinion
Benchmarking - When You Want To… • Answer “How do I compare?” • Determine financial health • Obtain a single version of the truth • Make better informed decisions
INTERESTED PARTIESA DIFFERENCE IN PERSPECTIVES • THE BOARD - Profitability, Reserves, New Business Ventures, Mergers & Acquisitions • THE STAFF - Compensation, Benefits, Working Environment • THE AUDITOR - Financial Health, Risk Assessment, Management Advisory Services - Best Practices • THE MEMBERS - Needs, Service, Value, Measuring Your Industry - Sector Analysis • SERVICES AND SUPPLIERS - Quality, Performance, Competitiveness • EXPLORE POSSIBILITIES -
STRATEGIC PRIORITIES • Financial Health • Quality Events for Member/Sponsor Needs • Awareness/Action on Advocacy Issues • Member & Participant Growth and Activity • Knowledge and Information Transfer • Broadened Programmatic Coverage • Professional, Positive Work Environment
OBJECTIVE / GOAL DETERMINATION Interested Parties BOARD STAFF AUDITOR MEMBERS SERVICES SUPPLIERS Financial Health Quality Events for Member/Sponsor Needs Awareness/Action on Advocacy Issues Member & Participant Growth and Activity Knowledge and Information Transfer Broadened Defense & National Security Sector Coverage Professional, Positive Work Environment
Business/Mission Success Strategic Plan Goal 1 Goal 2 Goal 3 Goal 4
CANDIDATE AREAS • Service quality • Asset use • Staff performance • Program performance • Operating efficiency • Customer satisfaction • Return on investment • Project time to benefit
GROUP EXERCISE • What are you trying to measure? • How do your currently measure it? • How often do you measure it? • Is it helping you to improve performance? • If not, how can you fine tune your measurement?
Sources For Benchmarking Data • ASAE & The Center’s ORR • ASAE & The Center’s P&P • Compensation & Benefit Studies • GuideStar – More than just 990s • Customized Data Collection
USE OF BENCHMARKING TOOLS ASAE’s Operating Ratio Report Twelfth Edition, Vol I & II What’s In There?
What is ASAE’s ORR • Compilation of financial data from participating associations • First published in 1953 • Collected via Federal Forms 990 and survey supplements
What Data is in the 12th Edition? • Approx. 7,000 associations were requested to send in data in April 2003 • Reminders sent in May and June • By the end of June 628 valid surveys were utilized to compile the statistics enumerated in the 12th Edition – 9% response rate • Therefore 95% certain that results are within +/- 4% (when data is supported by the full sample size)
How Do I Extract Data That Is Relevant to My Association? Data Categories • Membership Type • IRS Tax Status • Total Ass’n Gross Revenue • Geographic Scope (Int’l/Nat’l or Regional/State/Local) • Metropolitan Area (e.g., DC, NYNY, etc.) • Industry Sector/Interest Area
Content Sections – Vol I • Revenue and Expense Information • IRS Form 990 Information • Balance Sheet Information • Specialized Sections • Industry Sector • Metropolitan Area • Geographic Scope
Content Sections – Vol II • Expense Information • 10-Year Trend Analysis 1993-2003 • Revenue and Expense • IRS Form 990 Schedule • Balance Sheet Information • Reserves and Investment Information
Dues As Percentage of Revenue(Dues Reliance) By membership type (all organizations): Mainly Company/Institutional Members = 39.2% Mainly Individual/Professional Members = 30.1% By size / by membership type & size: Gross RevenueAll OrgsC/II/P $500K or less = 62.4% 63.5% 56.4% $500K - $1M = 30.1% 37.0% 25.8% $1M - $2M = 35.5% 38.2% 29.5% $2M - $5M = 35.0% 36.1% 34.1% $5M - $10M = 29.2% 32.2% 29.0% $10M+ = 30.4% 41.4% 23.7%
Salaries & Benefits • Average Salaries - Geographically • Average Benefits - By Size ($) • Average Salaries and Total Revenue per Staff Member – By Industry Sector
Trend Analysis - Investment Composition(as a percentage of total assets)
Trend Analysis – Meetings Sponsorship Revenue(Percentage of Total Revenue)
Trend Analysis – Periodical Advertising(Percentage of Total Revenue)
Trend Analysis –Personnel Benefits(Percentage of Total Revenue)
Trend Analysis –Personnel Benefits(Average Benefits per Staff Member)
Trend Analysis – Printing & Photocopying Costs(Percentage of Total Revenue)
Average Reserve Target Reserves defined as total net assets and as a percent of annual operating budget • 501(c)(3) 76% • 501(c)(6) 59%
Investment Policies All Assns501(c)(3)501(c)(6) Cash Investments 21% 24% 20% S-T Investments 23% 19% 26% L-T Investments 53% 58% 53% Other Investments 3% 0% 1%
USE OF BENCHMARKING TOOLS ASAE & The Center’s Policies and Procedures in Association Management (A Benchmarking Guide)
P & P • 7,403 membership organizations were sent questionnaires in mid-April 2005 • Responses were closed on June 30, 2005 • 1,111 associations responded (15% response rate compared to 8% in 2001) • Over 600 tables of benchmarking data in seven volumes • 95% confidence of 4% margin of error (just like 12th Edition of ORR)
Respondents • 46% Trade Associations / 54% Individual Member Organizations • 56% 501(c)(6) / 37% 501(c)(3) • 68% budgets <$5M • Median annual budget = $1.9M • Median FTEs is 10 (actual FTEs 1 – 182)
Best “Average” Measure Median – ½ respondents above; ½ below Mean – sum of all cases / total # of respondents Median is a better measure for average when the upper limit is theoretically infinite (e.g., # members, annual budget), as the mean can be strongly affected by very high values. # Members (Mean = 58,687 / Median = 1,500) Annual Budget (Mean = $6.4M / Median = $1.9M)
HOW MUCH OF REVENUE IS MADE UP OF DUES? • Dues as a percentage of total revenue are inversely related to size by number of FTE’s
TELECOMMUTING • 55% - TELECOMMUTING FROM HOME IS PERMITTED • 64% - ORGANIZATIONS WITH MORE THAN 30 FTE’S ALLOW TELECOMMUTING • 43% - PROVIDE COMPUTERS AND EQUIPMENT
TECHNO-MARKS • 68% - USE WINDOWS XP • 62% - USE # OF WEBSITE HITS TO EVALUATE EFFECTIVENESS • 33% - USE SURVEYS AND ONLINE FEEDBACK TO MEASURE WEBSITE EFFECTIVENESS • 44% - UPDATE WEBSITE DAILY • 31% - UPDATE WEBSITE WEEKLY
Financial Policy Metrics • 56% of the reporting associations have fiscal years coinciding with the calendar year • Median liquid reserves are 26% • 79% of the reporting associations publish a flagship periodically issued publication • 87% report that their organization is subject to an annual independent audit • 5% report they have been audited by the IRS in the last three years • Median percentage of non-deductible dues is estimated at 11%
Sarbanes Oxley (SOX) • Whistleblower Policy • 22% have • 74% adopted after SOX • Audit Committee • 52% have • 24% in place after SOX • Staff Ethics Statement • 48% have • 18% adopted after SOX