412 nm
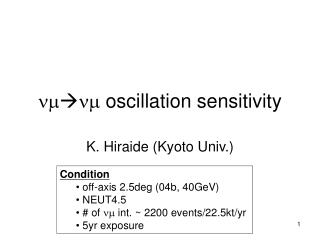
Summer. Winter. Reflectivity(%). 20. 15. 10. 5. 0. 30. 20. 10. Radiances 412, 490, 670 nm. 0. 3x3 Pixels Spatial Variance at 412 nm. 412/490 Absorbing Aerosol Index. 50. Yes. No Retrieval. Cloudy?. 40. No. 30. 490, 670 nm Surface Reflectivity (0.1ºx0.1º).

412 nm
E N D
Presentation Transcript
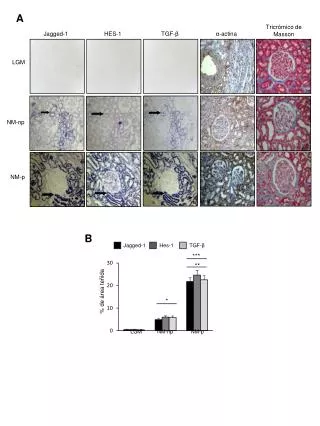
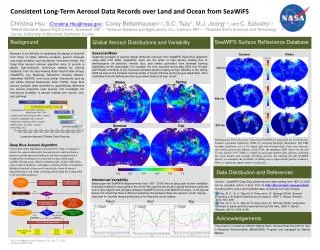
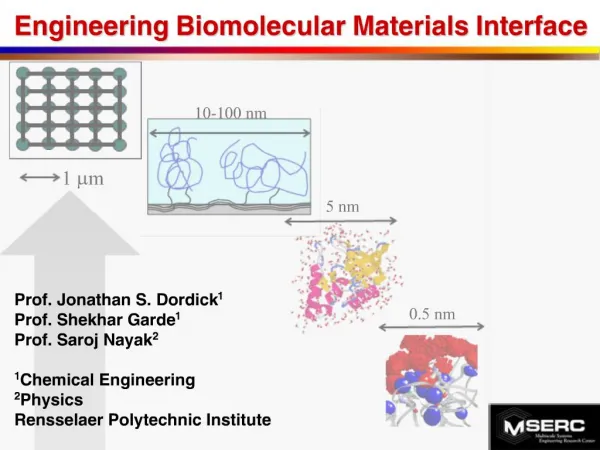
Summer Winter Reflectivity(%) 20 15 10 5 0 30 20 10 Radiances 412, 490, 670 nm 0 3x3 Pixels Spatial Variance at 412 nm 412/490 Absorbing Aerosol Index 50 Yes No Retrieval Cloudy? 40 No 30 490, 670 nm Surface Reflectivity (0.1ºx0.1º) 412 nm Surface Reflectivity (0.1ºx0.1º) Surface Reflectance Determination 20 10 Coarse Mode (dust, seasalt) Fine Mode (smoke, sulfate) Aerosol Type 0 Fine or Mixed Aerosols Dust Dominant Maximum Likelihood Method Single-Scattering Albedo Aerosol Optical Thickness Aerosol Optical Thickness Ångström Exponent + + Consistent Long-Term Aerosol Data Records over Land and Ocean from SeaWiFS Christina Hsu1(Christina.Hsu@nasa.gov), Corey Bettenhausen1,2, S.C. Tsay1, M.J. Jeong1,3, and C. Salustro1,2 1NASA Goddard Space Flight Center, Greenbelt, MD --- 2Science Systems and Applications, Inc., Lanham, MD --- 3Goddard Earth Sciences and Technology Center, University of Maryland, Baltimore County Background SeaWiFS Surface Reflectance Database Global Aerosol Distributions and Variability 412 nm Seasonal Mean Seasonal averages of aerosol optical thickness retrieved from SeaWiFS Deep Blue algorithm using data from 2006. Apparently, there are hot spots of high aerosol loading due to anthropogenic air pollution, mineral dust, and smoke generated from biomass burning depending on the seasonality. For example, the fires occurred during May 2006 over Europe and Russia contribute to the observed elevated aerosol loading at high latitudes in the spring 2006 as well as the biomass burning smoke in South America during August-September. Dust outbreaks from the Sahara are also a persistent feature all year round. Because of the difficulty in separating the signals of aerosols from those of highly reflective surfaces, aerosol retrievals over bright surfaces, such as deserts, have been limited. The Deep Blue aerosol retrieval algorithm aims to provide a global, high-resolution, continuous dataset by utilizing radiances from the Sea-Viewing Wide Field-of-View Sensor (SeaWiFS), the Moderate Resolution Imaging Spectro- radiometer (MODIS), and future similar instruments such as the Visible Infrared Radiometer Suite (VIIRS). Deep Blue aerosol products allow scientists to quantitatively determine the aerosol properties near sources and investigate the interannual variability of aerosol loading over source, sink, and, pathway. Spring Winter 490 nm Summer Fall 670 nm Long-term Aerosol Climate Data Records Instantaneous TOA reflectance values from SeaWiFS for each pixel are converted into Lambert-equivalent reflectivity (LER) by assuming Rayleigh atmosphere. The LER are then sorted into a 0.1 x 0.1 degree grid and averaged daily. Since most aerosols and clouds increase the radiance at the TOA, the minimum LER value over the full 12-year dataset (1997-2008) is sought for each grid element after rigorous screening for cloud shadow and strongly absorbing aerosols. By utilizing the full SeaWiFS dataset, we maximize the possibility of finding one to represent the pristine condition. This is a significant improvement over the past. Deep Blue Aerosol Algorithm A flowchart of the algorithm is shown below. After screening for clouds, the surface reflectivity for each pixel is retrieved from a database and the measured radiances are then compared with a lookup table of radiances as a function of solar zenith angle, satellite viewing angle, relative azimuth angle, surface reflectivity, aerosol optical thickness, and single-scattering albedo. A maximum likelihood method is then used to match the values of aerosol optical thickness and single scattering albedo from the lookup table to the measured radiances. Data Distribution and References 0.2 0.4 0.6 0.8 1.0 0.0 Interannual Variability Based upon the SeaWiFS measurements from 1997 - 2008, there is large year-to-year variability of aerosol loading in many parts of the world. We examine the aerosol optical thickness variations over 3 dust regions and compare between SeaWiFS (circles) and MODIS (crosses) in the figures below. It is noted that there is different sampling rate between these two sensors, which may be important for monthly means particularly over frequently cloud regions. Version 1 SeaWiFS Deep Blue global aerosol data starting from 1997 to 2008 will be available online in April 2010 at http://disc.sci.gsfc.nasa.gov/dust/, including both Level 2 and 3 gridded data, as well as true color images. Hsu, N. C., S.-C. Tsay, M. D. King, and J. R. Herman (2004). Aerosol properties over bright-reflecting source regions. IEEE T. Geosci. Remote, 42(3), 557–569. Hsu, N. C., S.-C. Tsay, M. D. King, and J. R. Herman (2006). Deep blue retrievals of asian aerosol properties during ACE-Asia. IEEE T. Geosci. Remote, 44(11), 3180–3195. May March April Acknowledgements This project is funded by NASA’s Making Earth Science Data Records for Use in Research Environments (MEaSUREs) Program and managed by Martha Maiden. AGU Fall Meeting, San Francisco, CA, Dec 17, 2009 Abstract IN43B-1149


![Nm]](https://cdn3.slideserve.com/6300766/slide1-dt.jpg)