Download
1 / 8
80 likes | 101 Views
This paper discusses the simulation of experimental photonic crystal (PC) samples, focusing on the dependence of losses on the hole depth and width of the guiding layer. It also examines the effect of conical shapes of the holes and compares 2D and 3D modelling. The examination and validation of the 2D model and 3D FDTD simulation of experimental samples are presented.

E N D
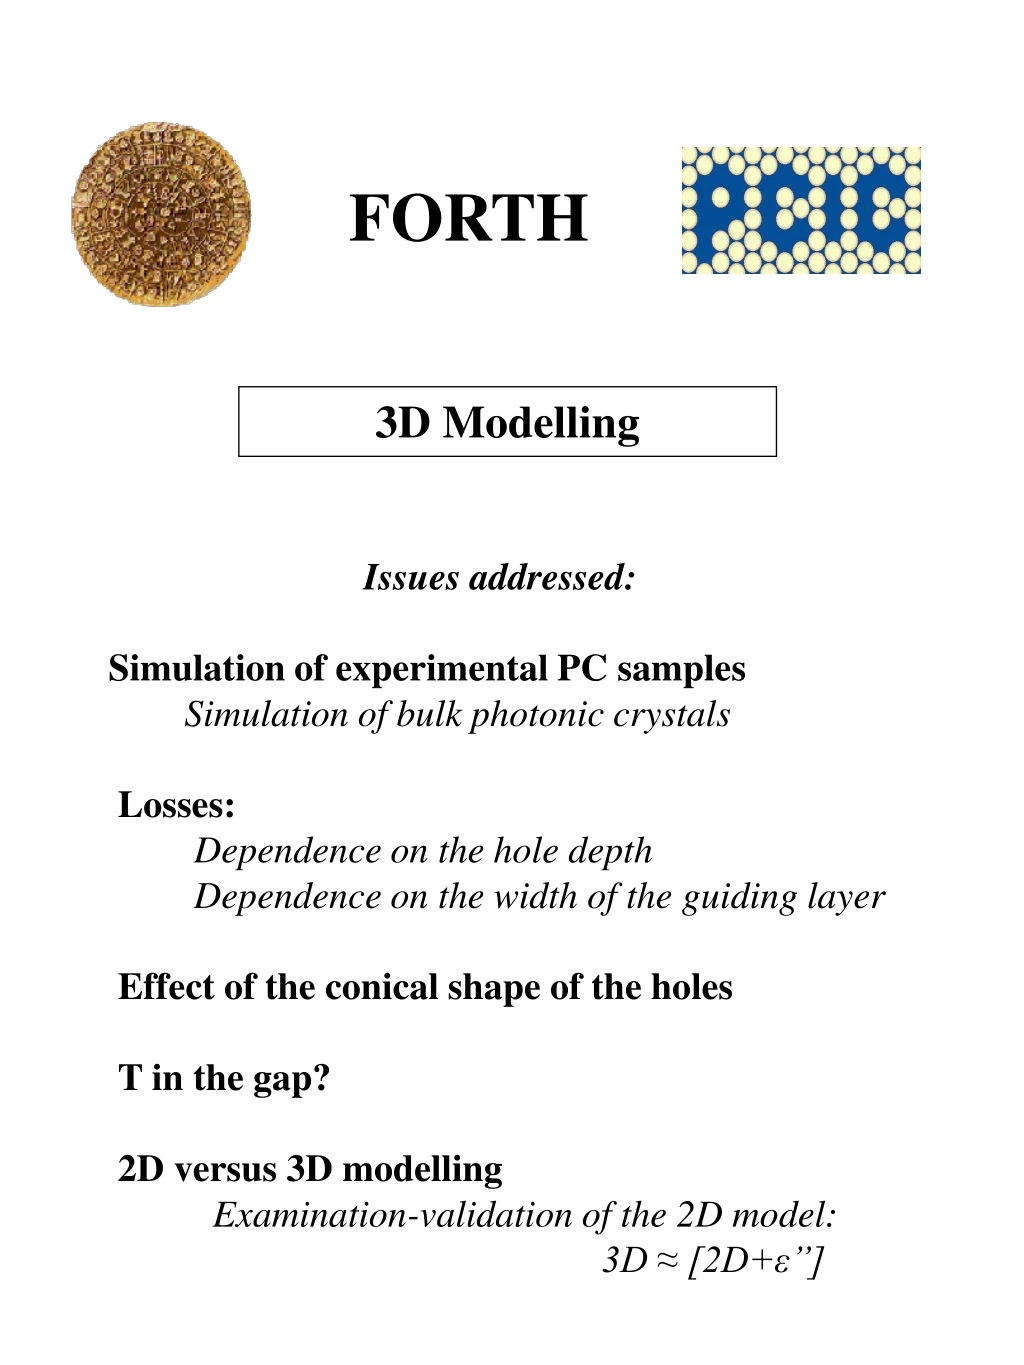
FORTH 3D Modelling Issues addressed: Simulation of experimental PC samples Simulation of bulk photonic crystals Losses: Dependence on the hole depth Dependence on the width of the guiding layer Effect of the conical shape of the holes T in the gap? 2D versus 3D modelling Examination-validation of the 2D model: 3D ≈ [2D+ε’’]
3D FDTD simulation of experimental samples ~ΙWΚ2 ~IOO3 ε=1, d=200nm ε=10.106, d=200 ε=11.2627, d=452 ε=10.106, d=800 ε=9.9225, d=1400 ε=1, d=200nm ε=10.0489, d=200 ε=11.2225, d=434 ε=10.0489, d=2200 Depth=1.5 & 2.5μm a=240 & 420 nm Depth= 2.5μm, a= 420 nm ~IOO3
IWK2, ΓM, f=0.3, depth=1.5 μm Experimental lattice constant: a=240 nm to a=500 nm. Exper. hole depth: 1.5 μm to 2.5 μm.
Effect of conical holes? Smaller f smaller influence of the conical shape Conical holes destroy the “PBG mode – layers mode” mismatch Straight h. Conical h. Field |E| for the ~IOO3 (f=0.51, depth=2.5 μm)
T versus hole depth Legends show total depth T(a=240 nm) > T(a=420 nm) (more confined guided mode for a =240 nm less influenced by depth)
Transmission in the gap? Pulse inside the gap; a=240 nm, IWK2 parameters, depth=1.5 μm, f=30% The horizontal lines where the field shows peaks correspond to the guiding layer – claddings interfaces. IWK2: Monochromatic wave, a=420 nm, a/λ=0.27, depth=834 nm, f=30% The black arrows show layers interfaces. The white arrow shows the holes bottom. IOO3: Monochromatic wave, a=420 nm, a/λ=0.35, depth=2.5 μm, f=51% The horizontal lines where the field shows peaks correspond to the layers interfaces. The arrow shows the holes bottom.
2D versus 3D GK direction, 8-unit cells. 2D FDTD: e=10.3, f=38%,e”=0.05. 3D FDTD: f=35%, a=420 nm, depth=2.5 μm,InP structure, straight holes GK direction, 8-unit cells. 2D FDTD: e=10.3, f=38%,e”=0.12. 3D FDTD: f=35%, a=420 nm, depth=2.5 μm,InP structure, conical holes 3D FDTD≈ 2D FDTD with εeff and feff
T versus length of the system T(L)1-bLn with n=1/4 and b constant