Low-Level Copy Number Analysis CRMA v2 preprocessing
960 likes | 981 Views
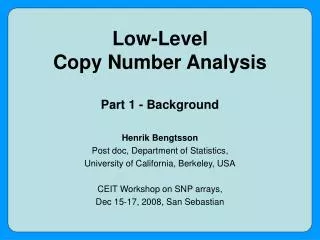
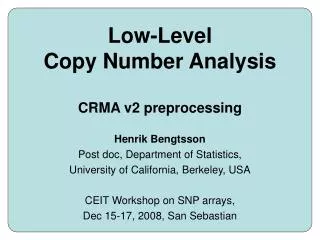
Low-Level Copy Number Analysis CRMA v2 preprocessing. Henrik Bengtsson Post doc, Department of Statistics, University of California, Berkeley, USA CEIT Workshop on SNP arrays, Dec 15-17, 2008, San Sebastian. *. *. *. *. *. *. *. *. *. CN=1. CN=2. CN=3. PM = c. PM = 2c.

Low-Level Copy Number Analysis CRMA v2 preprocessing
E N D
Presentation Transcript
Low-LevelCopy Number AnalysisCRMA v2 preprocessing Henrik Bengtsson Post doc, Department of Statistics, University of California, Berkeley, USA CEIT Workshop on SNP arrays, Dec 15-17, 2008, San Sebastian
* * * * * * * * * CN=1 CN=2 CN=3 PM = c PM = 2c PM = 3c Copy-number probes are used to quantify the amount of DNA at known loci CN locus:...CGTAGCCATCGGTAAGTACTCAATGATAG... PM:ATCGGTAGCCATTCATGAGTTACTA
* * * * * * * * * * * * * * * * * * * * * * * * AA AB AAB PM =PMA+PMB = 2c PM = PMA + PMB = 2c PM =PMA+PMB = 3c BB PM =PMA + PMB = 2c SNP probes can also be used toestimate total copy numbers *
* * * * * * * * * * * * * * * * * * * AA BB AB PMA >> PMB PMA << PMB PMA ≈PMB Crosstalk between alleles - adds significant artifacts to signals Cross-hybridization: Allele A: TCGGTAAGTACTC Allele B: TCGGTATGTACTC
There are six possible allele pairs • Nucleotides: {A, C, G, T} • Ordered pairs: • (A,C), (A,G), (A,T), (C,G), (C,T), (G,C) • Because of different nucleotides bind differently, the crosstalk from A to C might be very different from A to T.
BB AB PMB AA + PMA offset Crosstalk between alleles is easy to spot Example: Data from one array. Probe pairs (PMA, PMB) for nucleotide pair (A,T).
PMB + PMA no offset Crosstalk between alleles can be estimated and corrected for What is done: 1. Offset is removed from SNPs and CN units. 2. Crosstalk is removed from SNPs. BB AB AA
aroma.affymetrix You will need: • Affymetrix CDF, e.g. GenomeWideSNP_6.cdf • Probe sequences*, e.g. GenomeWideSNP_6.acs Calibrate CEL files: cdf <- AffymetrixCdfSet$byChipType("GenomeWideSNP_6") csR <- AffymetrixCelSet$byName("HapMap", cdf=cdf) acc <- AllelicCrosstalkCalibration(csR, model="CRMAv2") csC <- process(acc) To plot: plotAllelePairs(acc, array=1) plotAllelePairs(acc, array=1, what="output")
Crosstalk calibration corrects for differences in distributions too Before removing crosstalk the arrays differ significantly... ...when removing offset & crosstalkdifferences goes away. log2 PM log2 PM
4 measurements of the same thing: log2 PM With different scales: log(b*PM) = log(b)+log(PM) log2 PM With different scales and some offset:log(a+b*PM) = <non-linear> log2 PM How can a translation and a rescaling make such a big difference?
Take home message Allelic crosstalk calibration controls for: 1) offset in signals 2) crosstalk between allele A and allele B.
Nucleotide-Position Model Nucleotide-position effect () Position (t) Probe-position (log2) affinity for probe k: k = ((bk,1,bk,2,...,bk,25)) = t=1..25b={ACGT} I(bk,t=b)lb,t
Example: Probe-position affinity for CTCAGTGCCCAACAGATAAAGTCGT "Sum up effect"
Probe-sequence normalization helps • The effects differ slightly across arrays: • adds extra across-array variances • will be removed • The effects differ between PMA and PMB: • introduces genotypic imbalances such that PMA+PMB will differ for AA, AB & BB. • will be removed
Array #2: =0.20 Array #1: = 0.16 Average array: = 0.18 Array #60: = 0.13 The nucleotide-position effectdiffer between arrays
The impact of these effects varies with probe sequence Array #2: =-0.10 Array #1: = -0.17 Average array: = -0.13 Array #60: = -0.18
There is a noticeable difference in rawCNs before and after normalization without With BPN
There is a noticeable difference in rawCNs before and after normalization Without
There is a noticeable difference in rawCNs before and after normalization With BPN
Nucleotide-position normalization controls for imbalances between allele A & allele B PMA: = 0.53 Genotypic imbalances:PM=PMA+PMB: AA: 0.53+0.53 = 1.06 AB: 0.53+0.22 = 0.75 BB: 0.22+0.22 = 0.44 Thus, AA signals are 2^(1.06-0.44) = 2^0.62 = 1.54 times stronger than BB signals. PMB: = 0.22
(i) Before calibration there is crosstalk- pairs AC, AG, AT, CG, CT & GT
(ii) After calibration the homozygote armsare more orthogonal (note heterozygote arm!)
(iii) After sequence normalization the heterozygote arms are more balanced
aroma.affymetrix You will need: • Affymetrix CDF, e.g. GenomeWideSNP_6.cdf • Probe sequences*, e.g. GenomeWideSNP_6.acs Normalize CEL files: bpn <- BasePositionNormalization(csC, target="zero") csN <- process(bpn) Works with any chip type, e.g. resequencing, exon, expression, SNP. To plot: fit <- getFit(bpn, array=1) plot(fit)
Probe summarization(on the new arrays) • CN units: All single-probe units: • Chip-effect estimate: ij = PMij • SNPs: Identically replicated probe pairs: • Probe pairs: (PMijkA,PMijkB); k=1,2,3 • Allele-specific estimates: • ijA = mediank{PMijkA} • ijB = mediank{PMijkB}
aroma.affymetrix You will need: • Affymetrix CDF, e.g. GenomeWideSNP_6.cdf Summarizing probe signals: plm <- AvgCnPlm(csN, combineAlleles=FALSE) fit(plm) ces <- getChipEffectSet(plm) theta <- extractTheta(ces)
Probe-level summarization (10K-500K)- (if) replicated probes respond differently For a particular SNP we now have K added signals: (PM1, PM2, ..., PMK) which are measures of the same thing - the CN. However, they have slightly different sequences, so their hybridization efficiency might differ.
Probe-level summarization- different probes respond differently 18 probes for the same probe set Example: log2(PM1)= log2(PM2)+a1 => PM1 = 1*PM2 (1= 2a1) log(PM) 1 2 3 4 5 6 7 8 9 10 11 12 12 arrays with different expression levels
Probe-level summarization- probe affinity model For a particular SNP, the total CN signal for sample i=1,2,...,I is: i Which we observe via K probe signals: (PMi1, PMi2, ..., PMiK) rescaled by probe affinities: (1, 2, ..., K) A multiplicative model for the observed PM signals is then: PMik = k * i + xik where xik is noise.
Probe-level summarization- the log-additive model For one SNP, the model is: PMik = k * i + ik Take the logarithm on both sides: log2(PMik) = log2(k * i + ik) ¼ log2(k * i)+ ik = log2k + log2i + ik Sample i=1,2,...,I, and probe k=1,2,...,K.
Probe-level summarization- the log-additive model With multiple arrays i=1,2,...,I, we can estimate the probe-affinity parameters {k} and therefore also the "chip effects" {i} in the model: log2(PMik)= log2k + log2i + ik Conclusion: We have summarized signals (PMAk,PMBk)for probes k=1,2,...,K into one signal iper sample.
Idea of RLMM, BRLMM, CRLMM Find genotype regions for each SNP: • Pick a high-quality training data set for which we know the true genotypes, e.g. the 270 HapMap samples. • Estimate (ijA,ijB) for all samples and SNPs. • For each SNP, find the regions for all samples with AA, then with AB, and the with BB.- The regions will differ slightly between SNPs. • (Bayesian modelling of prior SNP regions) For a new sample: • For each SNP, identify the trained genotype region that is closest to its (ijA,ijB). That will be the genotype.
For some SNPs it is harder to distinguishthe genotype groups
Careful: Genotyping algorithms often assume diploid states, not CN aberrations
Crosstalk calibration (incl. the removal of the offset) gives better separation of AA, AB, BB. Without calibration: With calibration:
A more suttle example Without calibration: With calibration:
Longer fragments are amplified less by PCRObserved as weaker signals Note, here we study the effect on non-polymorphic signals, that is, for SNPs we first do ij = ijA + ijB.
Slightly different effects between arraysadds extra variation
Fragment-length normalizationfor multi-enzyme hybridizations • For GWS5 and GWS6, the DNA is fragmented using two enzymes. • For all CN probes, all targets originate from NspI digestion. • For SNP probes, some targets originate exclusively from NspI, exclusively from StyI, or from both NspI and StyI.
Fragment-length effects for co-hybridizedenzymes are assumed to be additive