Download
1 / 11
110 likes | 279 Views
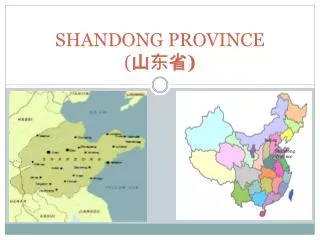
Shandong IBNET. IWA conference. Shandong economic status. Shandong is one of the richest provinces of China: The nominal GDP is second in the country (behind Guangdong )

E N D
Shandong IBNET IWA conference
Shandong economic status • Shandong is one of the richest provinces of China: The nominal GDP is second in the country (behind Guangdong) • Shandong benefits from South Korean and Japanese investment due to its geographical proximity to those countries. Economic development focuses on large enterprises with well-known brand names. • Shandong exploits extensive petroleum deposits: its Shengli Oilfield is the major oilfield of the country. • The richest part of the province is the Shandong Peninsula • The extreme inland west of Shandong is much poorer than the rest of the province.
Shandong water services Basic Characteristics • Water and wastewater services are provided by separate utilities • Universal coverage, 24 hour supply • Very high population density (more than 10,000 people per km of the distribution network; in Brazil it is 1,200-2,000 in largest cities) • Universal metering in all large and medium cities • Domestic consumption is below 40% of the total
Shandong water sector financial performance (2005) • Average revenue $0.22 per m3 • from population $0.15 per m3 • from industries $0.26 per m3 • Tariffs for industrial users are 40% higher than for population on average • Average operating cost coverage: 1.21 • if population tariffs for all users employed: below 1.0 • Collection rate average: 95% • Collection rate average from domestic consumers: 74%
Shandong vs. Brazil Unaccounted losses in %
Shandong vs. Brazil Unaccounted losses in m3 per km of network
Shandong vs. Brazil • Collection ratio
Shandong vs. Brazil • Staff per 1000 population customers
Shandong vs. Brazil • Operating cost coverage