Download
1 / 19
190 likes | 314 Views
Decay Effects in Online Advertising: Quantifying the Impact of Time Since Last Exposure. Authors: Christian Kugel, Starcom IP Bill Havlena, Ph.D., Dynamic Logic Jeffrey Graham, Dynamic Logic Presented at the ARF 50 th Annual Convention – April 26-28, 2004 – New York City.

E N D
Decay Effects in Online Advertising: Quantifying the Impact of Time Since Last Exposure Authors: Christian Kugel, Starcom IP Bill Havlena, Ph.D., Dynamic Logic Jeffrey Graham, Dynamic Logic Presented at the ARF 50th Annual Convention – April 26-28, 2004 – New York City
Starcom IP/Dynamic Logic Partnership • Starcom IP and Dynamic Logic have collaborated on more than 50 advertising effectiveness studies measuring the effects of both Internet and Television advertising • Starcom IP • Leading interactive agency • Dynamic Logic • Independent research company specializing in measuring marketing effectiveness • Has conducted studies for 47 out of Top 50 U.S. Advertisers
Purpose of this research • To quantify the decay dynamics of brand metrics following OTS of online advertising • Magnitude of decay • Rate of decay • Brand metrics of interest include: • Aided Brand Awareness • Aided Online Advertising Awareness • Message Association • Brand Favorability • Purchase Intent • Outcome will inform: • Media planning decisions such as scheduling • Impact of decay on Internet-based ad effectiveness measurement
Research hypothesis • Expectation is that as time since last exposure increases, branding scores will decrease • Because minimal literature exists, analysis was a discovery process designed to uncover: • Rate of decay (How fast the decay occurs) • Nature of decay (Which metrics are most affected)
Approaches explored • Primary data • Specifically designed to measure decay • One brand in relatively static situation • Apply AdIndex methodology to capture exposed respondents at some point following OTS • Benefits: controlled environment, homogenous data • Cons: cost and timing; limited data set • Normative data • Mine Dynamic Logic MarketNorms database • Based on time stamp field, identify cases which represent various periods of times between OTS and survey completion • Benefits: large amount of data readily available, cost, timing • Cons: Heterogeneous data could limit analysis
Data summary • Stratified sample of 2003 MarketNorms data • All cases where difference between OTS and survey completion is greater than one day • Random sample of 5,200 cases where survey occurred immediately following OTS • Respondents gathered from surveys across CPG, Auto, and Pharmaceutical verticals • Total sample n=28,416 • Models contained multiple controls, including frequency
MarketNorms overview • A vast normative database designed to be used as a strategic research, decision support and comparative tool for measuring online advertising and marketing effectiveness • 4+ years of data - 14,000+ creatives • 1200+ campaigns - 1,200,000+ respondents • Data collected using a control/exposed research design which isolates the effects of online advertising from other variables; most data collected shortly after last ad exposure • Variables measured that are relevant to the study: • Time since last exposure (electronic data) • Frequency (electronic data) • Demographics (survey data) • Industry category (study classification)
Analytical approaches • Respondent-level data • Logistic regression • Independent variables: Frequency and recency of OTS, age, gender, income • Dependent variables: Binomial indication of awareness or persuasion • Aggregated-level data • Cross-tab brand metrics with time (in days) since exposure • OLS regression against the tabbed data • Independent variable: Recency of OTS • Dependent variable: Percent of respondents at Day X who indicate affirmative response to brand metric
Findings – Respondent-level • Binary logistic regression testing relationship between time since last exposure (day intervals) and brand scores • Data tested with a variety of time intervals and controls • Overall respondent-level analysis indicates significant, but very small, negative impact of decay on 4 brand metrics at 95% level • Aided Brand Awareness • Aided Online Advertising Awareness • Brand Favorability • Purchase Intent • Positive impact of frequency on Aided Brand Awareness, Brand Favorability, and Purchase Intent at 95% level • No significant interaction effects between time since last exposure and frequency were observed
Findings – Respondent-level • Differences were observed across industry verticals for some metrics • Pharmaceutical category was the only vertical to exhibit significant decay in Online Ad Awareness at the individual respondent level • No significant effect of online ad exposure frequency was seen at the individual level within Automobile category when controlling for recency and demographic differences
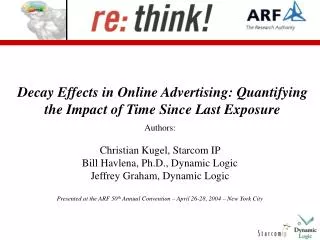
100 80 60 40 20 0 0 1 2 3 4 5 Time since last exposure (in weeks) Decay of Aided Brand Awareness • Relationship between brand score and time since last exposure is not monotonic and appears to be affected by intervening and other individual factors; other variables (such as demographics) played a significant role
Findings – Aggregated data • Only one of five brand metrics measured exhibited evidence of decay • Aided Online Advertising Awareness • “Days since last OTS” contributed a significant coefficient at 95% confidence • Aided Brand Awareness, Message Association, Brand Favorability, and Purchase Intent were not significantly predicted by recency of OTS • No clear evidence of decay in this data set
Decay of Aided Ad Awareness Adj. r2 = 0.603 • For every day since last OTS, aggregate aided online advertising awareness decreases 0.8 percentage points.
Conclusions/Implications • Both analytical methods suggest effects of decay on advertising effectiveness are limited • Disaggregated analysis using logistic regression indicates that recency and frequency alone offers poor predictive ability; Aggregated data also shows limited effects • Because rate of decay is not dramatic, decay may not significantly impact fairness of Internet-based ad effectiveness measurement
Recommendation for future research • Primary data can be applied to any brand for situation-specific insights • Specifically recruit respondents at various points since last OTS • Expectation is that any number of variables influence rate of and magnitude of decay • Study could be replicated within cross-media research study framework • Once decay dynamics are known, media planner should create scenarios to inform scheduling
Thank you! Christian Kugel, Starcom IP Bill Havlena, Ph.D., Dynamic Logic Jeffrey Graham, Dynamic Logic