Download
1 / 47
470 likes | 628 Views
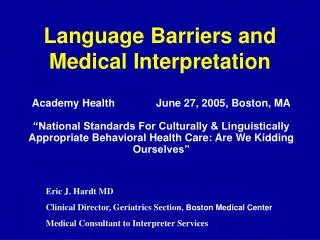
Language Barriers and Medical Interpretation. Academy Health June 27, 2005, Boston, MA “National Standards For Culturally & Linguistically Appropriate Behavioral Health Care: Are We Kidding Ourselves”. Eric J. Hardt MD

E N D
Language Barriers and Medical Interpretation Academy Health June 27, 2005, Boston, MA “National Standards For Culturally & Linguistically Appropriate Behavioral Health Care: Are We Kidding Ourselves” Eric J. Hardt MD Clinical Director, Geriatrics Section, Boston Medical Center Medical Consultant to Interpreter Services
Linguistic Minorities in the USA Definition of NES, LEP
Language and Access Mandates 4. Offer and provide language timely assistance services without charge 5. Inform patients of their right to receive language assistance services 6. Interpreters and bilingual staff 7. Patient-related materials and signage
Interactions between Culture and Language • Scenarios that include language barriers are very likely to present “cross-cultural” issues: • Bias/discrimination/stereotypes/racism [both personally-mediated and institutionalized] • Culturally-mediated diversity in health-related behaviors/values/preferences • Power differentials E Hardt 2005
Roles for Medical Interpreters in Relation to “Cultural” Issues • Interpreter is the conduitvia which the culturally competent provider may explore differences in health related beliefs and behaviors • Interpreter adopts an expanded rolethat includes explanation of features of medical and of patient culture and brokerage of relationships between patient and provider • IN EITHER CASE THE PRIMARY RESPONSIBILITY OF THE INTERPERTER IS TO FAITHFUL TRANSMISSION OF MESSAGES E Hardt 2005
Clinical Issues I • Outreach and marketing, signage, telephone access • “Taking a history” and doing the PE • Clinical evaluation [ e.g. CAGE, Folstein MMSE, peak flow] • Ordering, interpretation, and performance of tests [e.g. CAT, MRI, ETT, PFTs] • Procedures [ e.g. colonoscopy, conscious sedation, labor and delivery ] • Patient education, counseling, discharge instructions, preps, written materials E Hardt 1988
Clinical Issues II • Consent for treatment/procedures/studies • Follow-up of test results, appointment compliance • Medication compliance, adverse drug reactions, allergies • Cost containment, managed care • Risk management, medical errors, standards of care • Doctor-patient relationships, patient satisfaction E Hardt 1988
Research Data and Advocacy Needed to change attitudes of law and policy makers, remodel provider behavior and clinical systems, establish credibility for interpreters.
Do We Have Health Care Disparities related to Language Barriers? How big are they? For what groups? In what areas? How do we document them? What are the costs? What can be done? Who should be doing it?
Selected Research Issues • Inclusion of potential LEP subjects • Translation and validation of instruments • Research infrastructure and personnel, information systems • Definitions [ PLINE, NES, LEP; “interpreters” and translators ] and data collection methods • Role of IRBs • Research agenda • Budgets and funding; involvement of Interpreter Services E Hardt 2005
The Exclusion of Non-English-Speaking Persons from Research • Survey of 172 responding researchers on provider-pt relations • Only 22% included LEPs who were potential subjects • Reasons for exclusions: • didn’t think of it • translation issues • staffing issues • no potential LEP subjects Frayne SM et al J Gen Intern Med 1996
PROVIDER MAY NOT [OCR]: • Provide service to LEP clients that are more limited in the scope or that are lower in quality than those provided to other persons • Subject a LEP client to unreasonable delays in the provision of services • Limit participation in program or activity on the basis of English proficiency • Provide services to LEP persons that are not as effective as those provided to those who are proficient in English • Require a LEP client to provide and interpreter or to pay for the services of an interpreter
VNS of Western MA: OCR Action I • July 1998 intake RN and supervisor refused to accept referral of Spanish-speaking diabetic because “she didn’t speak English and had no one to interpreter for her at home…” They claimed that this was “the new policy caused by budget cuts…” • Patient was a recipient of Medicare/Medicaid • Case reported to OCR by RN on behalf of pt.
VNS of Western MA: OCR Action II • By November 1998 the VNS had entered into a compliance agreement with the OCR: • Services for LEP patients were restored • VNS contracted with a telephone interpretation agency and instructed staff re its utilization • Bilingual staff were recruited and hired and matched to patients when possible • The VNS was deemed by the OCR to be once again in compliance with Title VI of the Civil Rights Act of 1964 and eligible for federal money
Studies on Language Barriers • Satisfaction • Access • Utilization of Health Care • Quality of Care • Costs • Interventions
Impact of Language Barriers on Patient Satisfaction in an Emergency Department • Survey of 2333 pts in 5 urban academic EDs • 15% NES (? LEP status) • Overall satisfaction: 52% for NES vs. 71% for ES • Willingness to return: 86% for NES vs. 91.5% for ES • NES pts more likely to report overall problems with care, communication and testing Carrasquillo O et al JGIM 1999
Effect of Spanish Interpretation Method on Patient Satisfaction • 233 Eng-speaking [ES] and 303 Span-speaking [SS] pts in CO urban walk-in clinic, mean age 32 • 128 of SS seen by language concordant MD [LC] • 59 SS used AT&T, 69 SS used family members, 47 SS used ad hoc interpreters • Overall satisfaction was identical for ES, LC, and AT&T at 77 % Vs 54 % for those using family and 49% for those using ad hoc interpreters Linda Lee et al, JGIM 2002
Patient Assessment of Medicaid Managed Care • Consumer Assessment of Health Plans Study [49,327 PTs/14 states, 1999-2000] • Linear regression model within/between plans; telephone/mail survey in Eng & Span • NES reported lower ratings of care [access, timeliness, provider communication, staff helpfulness, & composite] • White NES and Hispanic Spanish-speakers clustered in worse plans • Most observed racial/ethnic difference in ratings attributable to within plan variation including those for NES Asians Weech-Maldonado et al, JGIM 2004
Importance of MD Training in Use of Interpreters in the OPD • 158 MD questionnaires about last clinic visit involving an interpreter [?type] at SFGH • 85 % satisfied with ability to Dx and Rx; but only 45 % satisfied with ability to educate and empower the PTs about Dx, Rx, meds • Previous training in interpreter collaboration was associated with higher IS use and better satisfaction with medical care Karliner L et al, JGIM 2004
Studies on Language Barriers • Satisfaction • Access • Utilization of Health Care • Quality of Care • Costs • Interventions
One in Five Have Gone Without Care When Needed Due to Language Obstacles 19% Have Not sought care when needed due to language barrier HQ11: In the course of the past year, how many times were you sick, but decided not to visit a doctor because the doctor didn’t speak Spanish or have an interpreter? Source: Wirthlin Worldwide 2002 RWJF Survey
Racial/Ethnic Differences in Children’s Access to Care • Data from 1996 Medical Expenditure Panel Survey (MEPS) • 6900 US children, 9% lacking usual source of care • 6.0% of Whites, 12.5% of AAs, 17.2% of Hispanics • For Hispanics, 40.7% were interviewed in Spanish, 59.3% were interviewed in English • Hispanic LEPs 27% as likely as Whites to have regular source of primary care • No difference between English-speaking Hispanics and Whites Weinick RM et al Am J Public Health 2000
Slide 7 Smoking Cessation Counseling Percent of current smokers counseled by physician to quit Source: The Commonwealth Fund 2001 Health Care Quality Survey.
Studies on Language Barriers • Satisfaction • Access • Utilization of Health Care • Quality of Care • Costs • Interventions
Does a Physician-Patient Language Difference Increase the Probability of Hospital Admission? • Prospective observational study of 653 adult [AP] and 79 pediatric [PP] pts in the ED at NYU Med Center Queens • 14.7% of APs and 12.7% of PPs preferred non-English [NES] • 52% of NES APs and 17% of NES PPs used “interpreters” • No trained or professional interpreters were used • NES APs were more likely to be admitted than ES controls, [35% vs. 21%, RR 1.70 {1.14-2.53}]. No difference for PPs. • Difference persisted after multivariate analysis for age, gender, acuity level, and presence of an “interpreter”. Lee ED et al Acad Emerg Med 1998.
Effect of English Language Proficiency on Length of Stay I • Retrospective review of administrative data on consecutive admissions to 3 major Toronto teaching hospitals 1993-1999 • LOS differences analyzed for 23 medical and surgical conditions [59,547 records] and then meta-analysis of 220 case mix groups [189,119 records] • Similar analysis for in-hospital mortality John-Baptiste A et al, JGIM 2004
Effect of English Language Proficiency on Length of Stay II • LOS for LEP patients longer for 7 of 23 conditions [unstable coronary syndromes and chest pain, CABG, stroke, craniotomy, diabetes, hip replacement, GI procedures] • Differences range from 0.7 to 4.3 days • Overall LEP LOS 6% longer [ approx 0.5 days ] • No increased risk of in-hospital death John-Baptiste A et al, JGIM 2004
Studies on Language Barriers • Satisfaction • Access • Utilization of Health Care • Quality of Care • Costs • Interventions
Ethnicity as a Risk Factor for Inadequate Emergency Department Analgesia • 139 pts with long bone fracture in UCLA ED • 108 NHWs, 31 Hispanic (42% NES, ?LEP) • Hispanics twice as likely to get no ED pain Rx [OR 7.46; 95% CI, 2.22-25.02; p<0.01] • NES status was borderline significant predictor [OR 3.12; 95% CI, 0.98-9.83; p=0.052] Todd KH et al JAMA 1993
Understanding Instructions for Prescription Drugs Those Prescribed Medication Source: Andrulis D, et al. What a Difference an Interpreter Can Make: Health Care Experiences of Uninsured with Limited English Proficiency, March 2002
Quality of Diabetes Care for Non-English-Speaking patients: A Comparative Study • Retrospective cohort study of 622 diabetics, 93 LEPs • Academic medical center and county hospital • Virtually all LEPs (24 languages) arrived with professional interpreters • LEPs more likely to get • 2 or more Hgb AlC per year • 2 or more clinic visits per year • 1 or more dietary consults • No differences in other labs, complications, use of other services, and total changes. Tocher TM et al West J Med 1998
Studies on Language Barriers • Satisfaction • Access • Utilization of Health Care • Quality of Care • Costs • Interventions
Language Barriers and Resource Utilization in a Pediatric ED • 2467 patients in an urban, academic pediatric ED • 12% LEP, 8.5% with LB with MD • For cases with LB: • higher test ($145 vs. $104) • Longer ED stay (165 vs. 137 minutes) • Analysis of covariance: • LB accounted for $38 and 20 minutes Hampers Pediatrics 1999 LC et al
Does the Use of Trained Medical Interpreters Affect ED Services, Charges, and Follow-up? • Retrospective chart reviews of 503 pts in Boston Med Ctr ED • CC: CP/SOB, HA, ABD pain, pelvic pain/vag bleeding • 66 Eng-speakers [ESPs], 63 Spanish, Haitian, Cape Verdean pts using hospital interpreters [IPs], 374 LEP pts not using interpreters [NIPs] • NIPs had shortest ED stay [p .001] and fewest tests [p .04] and prescriptions [p .03] • IPs were more likely to make clinic follow-up and less likely to return to the ED than NIPs [p .03] • Among non-admitted pts, return visit ED charges and total subsequent 30 day charges were reduced for IPs compared to NIPs and ESPs. Bernstein J et al. Journal of Immigrant Health 2002; 4: 171-176.
Language Barriers in Health Care: Costs and Benefits of IS • Follow up analysis of intervention study at major HMO as it increased interpreter services [IS] • Average cost of IS per LEP member $234/yr • For HMO overall, total costs averaged $0.20 per member per month • Average cost of IS encounter $79 at the time which can be expected to decline with increasing efficiency Jacobs E, et al. AJPH 2004; 94:366-369
Studies on Language Barriers • Satisfaction • Access • Utilization of Health Care • Quality of Care • Costs • Interventions
Effects of Interpreters on the Evaluation of Psychopathology in Non-English-Speaking Patients • 2 Public hospitals in NYC with no official interpreters • 30 psychiatric interpreter-interviews daily • Interpreters were other pts, friends, family, staff • Open discussions with providers and bilingual employees • Content analysis of 8 audio-taped interviews • Distortions resulted from interpreters’ poor language skills, lack of psychiatric knowledge, and attitudinal issues Marcos LR Am J Psychiatry 1979
When Nurses Double as Interpreters: Spanish-speakers [SS] in Primary Care • 21 SS pts with first walk-in visit to primary care clinic with untrained nurses used to interpret • Transcripts revealed serious miscommunication that affected understanding or credibility in 1/2 cases • MDs resisted reconceptualization in face of contradiction • Nurse provided data expected clinically vs. actual • Nurse interpretation reflected unfavorably on pts • Pts used cultural metaphors incompatible with Western clinical nosology not always interpreted Elderkin-Thompson et al, Soc Sci Med 2001
Impact of Interpretation Method on Clinic visit Length • Time motion study of 613 visits to PCU in RI with 28% LEP pts [90% Span-speakers] • Interpreted pts spent longer in clinic [93.6 vs. 82.4] and w/ provider [32.4 vs. 28.o] • Patients using telephone and patient-provided interpreters took longer; those using hospital interpreters did not • Authors calculated potential cost savings of reduced telephone usage and more efficient MD utilization in terms of potential hospital interpreters hired Fagan MJ et al JGIM 2003; 18: 634-638
Medical Interpreters Have Feelings Too I • Anonymous questionnaire of all 22 members of interpreter service of GRC • 5 had exposure to severe trauma [war, torture, detention, beatings] • 7 reported more than 50 % of sessions involved patients with exposure to violence • 5 frequently experienced difficult feelings during interpreting sessions
Medical Interpreters Have Feelings Too II • 66 % had frequently painful memories • 83 % reported seeing patients outside of the consultation setting • Interpreters expressed the need to talk and share feelings after the session with the medical doctor [83 %] or with relatives or spouse [44 %] Louton L et al Soz Praventivmed 1999
Mandates for Medical Interpreter Services • CLAS Standards • Office of Civil Rights [ORC] position • State laws [26 states and increasing] • Regulatory and review organizations (JCAHO, NCQA] • Risk management • Possible cost savings, market opportunities • Outcomes, quality • Justice
Massachusetts ED Interpreter Bill[Effective July 1, 2001] • Section 25J. Every acute-care hospital shall provide competent professional interpreter services in connection with all emergencyroom services and acute inpatient psychiatric services provided to a non-English- speaker or person who has difficulty in speaking or understanding the English language. • Section 3c. Any non-English- speaker who is denied effective health care services by a health care provider by reason of the provider’s not providing competent professional interpreter services should have a right of action in a superior court. • Governmental units are to reimburse the cost of interpreters for any mandated provider.
Selected Issues re Standards • Documentation: language status of patient in IS; interpreter utilization by site, shift, language, etc. • Risk Management: informed consent, staff education re expectations and availability • Clinical outcome measures including satisfaction, utilization, and quality indicators • Research inclusion and activity, related budgets • Training activity for staff and interpreters; notification of rights for patients E Hardt 2005
Might Language Competence Facilitate Cultural Competence? • Skills training viz language may invite and synergize with efforts to learn content and change attitudes while starting with a less threatening set of goals • Interpreter Services Department often catalyze/lead organizational efforts at CC • Methodology of organization’s approach to language-based disparities can model approach to other areas of disparities and growth potential E Hardt 2005
References and Bibliography • See NCIHC website [ National Council on Interpreting in Health Care], www. ncihc.org • www.calendow.org for annotated bibliography August 2003 • email me at: eric.hardt@bmc.org