Download
1 / 16
160 likes | 323 Views
Essential Mathematical Skills for Introductory Statistics Students. Roger E. Kirk Tomas P. Carpenter Department of Psychology & Neuroscience Baylor University. Attitudes Toward Taking A Statistics Class. “ When I realized that I had to take this course, I . . . ”. was scared

E N D
Essential Mathematical Skills for Introductory Statistics Students Roger E. Kirk Tomas P. Carpenter Department of Psychology & Neuroscience Baylor University
Attitudes Toward Taking A Statistics Class “When I realized that I had to take this course, I . . .” was scared panicked. I have heard horror stories about this course. wanted to die knew I’d have to take it twice Didn’t understand what it had to do with psychology Didn’t have any idea what to expect. Everyone has told me that it’s a killer.
nervous but interested knew it would be hard dreaded it, because of the rumors I heard about the class was apprehensive about the grading scale knew I’d be facing a challenge wanted to cry Wasn’t too thrilled thought that if I wanted to be a psychologist I would have to take it and suffer through it was frightened
Table 3. Performance of 3,281 Students on the Ten • Most Difficult Items Item Solve for or Fill In % Incorrect b = 75% = 71% < X < 66% < M < 65% 48%
Table 3. Continued Item Solve for or Fill In % Incorrect 46% b ≥ 42% = 40% 39% = 37%
Table 4. Performance of 3,281 Students on the Ten • Easiest Items Item Solve for or Fill In % Incorrect = 3% = 4% = 4% = 5% = 6%
Table 4. Continued Item Solve for or Fill In % Incorrect = 6% = 7% X= 8% = 9% = 10%
Table 5. Ten Best Predictors of Course Performance Item Solve for or Fill In Point Biserial r b ≥ .26 .25 .25 X= .24 b = .24
Table 5. Continued Item Solve for or Fill In Point Biserial r = .23 X = .23 .23 < M < .22 = .22
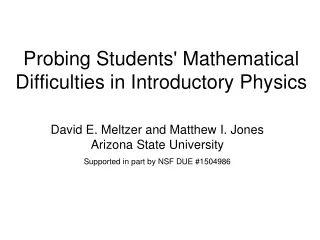
Mean Math Skills Test Academic Term Figure 1. Math test means are shown on the Y axis. The X axis is fall and spring semesters beginning in fall 1990 and ending in fall 2011. Error bars are 95% confidence intervals.
Figure 2. Effects of requiring a rigorous math prerequisite on course performance and Math Skills scores.
F 1994 S 1997 Mean Math Skills Test Academic Term Figure 3. The vertical lines at fall 1994 and spring 1997 define the years when a the rigorous math course was required for all psychology majors.