LCG P hysicist I nterfaces project
20 likes | 162 Views
#240 Status and Plans of the LCG PI project. CppUnit. 3D Histogram. Reference Histogram. SPI. Test Case 1. SEAL. Equal?. mean. mean. 2D Histogram. A I D A. Applications. PI. Equal?. RMS. RMS. User code (e.g. GEANT4). Test Case 2. 1D Histogram. …. Technology. Middleware.

LCG P hysicist I nterfaces project
E N D
Presentation Transcript
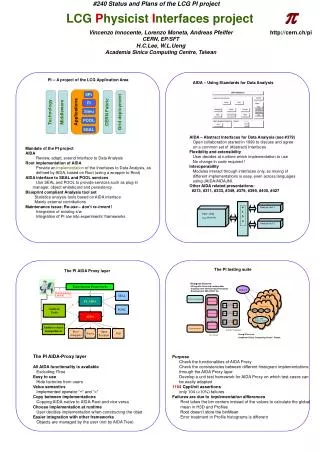
#240 Status and Plans of the LCG PI project CppUnit 3D Histogram Reference Histogram SPI Test Case 1 SEAL Equal? mean mean 2D Histogram A I D A Applications PI Equal? RMS RMS User code (e.g. GEANT4) Test Case 2 1D Histogram … Technology Middleware CERN Fabric Grid deployment I/O Simu Implement Copy Equal? binRms binRms … POOL Experimental Frameworks PI_AIDA AIDA Analysis object manipulators Analysis Tools Test Case n Analysis tool 2 Analysis tool 1 Mean, RMS binMean, binError ... POOL Target Histogram Testing Frameworks Open Scientist Root (wrapper) SEAL Native JAS Test Cases Exposing/Using AIDA IFs p LCGPhysicistInterfaces project Vincenzo Innocente, Lorenzo Moneta, Andreas Pfeiffer CERN, EP/SFT H.C.Lee, W.L.Ueng Academia Sinica Computing Centre, Taiwan http://cern.ch/pi PI -- A project of the LCG Application Area AIDA – Using Standards for Data Analysis AIDA – Abstract Interfaces for Data Analysis (see #379) Open collaboration started in 1999 to discuss and agree on a common set of (Abstract) Interfaces Flexibility and extensibility User decides at runtime which implementation to use No change in code required ! Interoperability Modules interact through interfaces only, so mixing of different implementations is easy, even across languages using JAIDA/AIDAJNI. Other AIDA related presentations: #213, #311, #333, #349, #379, #399, #400, #427 • Mandate of the PI project • AIDA • Review, adapt, extend Interface to Data Analysis • Root implementation of AIDA • Provide an implementation of the Interfaces to Data Analysis, as • defined by AIDA, based on Root (using a wrapper to Root) • AIDA interface to SEAL and POOL services • Use SEAL and POOL to provide services such as plug-in manager, object whiteboard and persistency. • Blueprint compliant Analysis tool set • Statistics analysis tools based on AIDA interface • Mainly external contributions • Maintenance issue: Re-use – don’t re-invent ! • Integration of existing s/w • Integration of PI s/w into experiments’ frameworks The PI testing suite The PI AIDA Proxy layer • Histogram Sources: • Filling with fixed and random data • Copying from different implementation • Reading from XML/ROOT file Hurng-Chun Lee Academia Sinica Computing Centre, Taiwan • The PI AIDA-Proxy layer • All AIDA functionality is available • Excluding ITree • Easy to use • Hide factories from users • Value semantics • Implemented operator “+” and “=“ • Copy between implementations • Copying AIDA-native to AIDA-Root and vice versa • Choose implementation at runtime • User decides implementation when constructing the objet • Easier integration with other frameworks • Objects are managed by the user (not by AIDA Tree) • Purpose • Check the functionalities of AIDA Proxy • Check the consistencies between different histogram implementations • through the AIDA Proxy layer • Develop a unit test framework for AIDA Proxy on which test-cases can • be easily adapted • 1164 CppUnit assertions • only 104 (<10%) failures • Failures are due to implementation differences • Root takes the bin centers instead of the values to calculate the global • mean in H3D and Profiles • Root doesn’t store the binMean • Error treatment in Profile histograms is different
#240 Status and Plans of the LCG PI project p LCGPhysicistInterfaces project Vincenzo Innocente, Lorenzo Moneta, Andreas Pfeiffer CERN, EP/SFT H.C.Lee, W.L.Ueng Academia Sinica Computing Centre, Taiwan http://cern.ch/pi Using Python as the integration bus simplifies integration Integrating with HippoDraw Using PyRoot from the SEAL project (see also: #175, #222) Integrating with Root from AidaProxy import * # create 1D and 2D histogram and plot them in a root canvas # usingfixed bin histograms as root doesn’t know about clouds h1 = Histogram1D("h1",“LogNormal Distribution",100,0,10) h2 = Histogram2D("h2",“Gaussian Distribution",100,0,100,100,0,100) # fill histograms with random gaussian points import random for i in range(0,5000) : h1.fill(random.lognormvariate(0,1)) h2.fill( random.gauss(45., 10.) , random.gauss(60., 20.) ) # create root canvas from rootPlotter import * rp=RootPlotter("AIDA to Root example",200,10,700,800) # set two canvas zones and options rp.canvas.Divide(2,1) rp.canvas.cd(1) rp.plot(h1) rp.canvas.cd(2) rp.plot(h2) from AidaProxy import * # create 1D and 2D cloud (unbinned histogram) and plot them using hippoDraw c1 = Cloud1D("MyCloud", "Log Normal Distribution") c2 = Cloud2D("MyCloud2", "Gaussian Distribution") # fill histograms with random gaussian points import random for i in range(0,5000) : c1.fill( random.lognormvariate(0,1) ) c2.fill( random.gauss(45., 10.) , random.gauss(60., 20.) ) # create HippoPLotter from hippoPlotter import * plHD=HippoPlotter() # plot cloud and create a binned histogram on a region plHD.plot(c1,'Histogram',['x','Entries/bin']) h1 = Histogram1D(“h1”,”Log Normal (Binned)”,100,0,5) c1=fillHistogram(h1) plHD.plot(h1) # now plot 2D clouds plHD.plot(c2,'Scatter Plot',['x','y']) plHD.plot(c2,'Color Plot',['x','y']) Cross-language interoperability Integrating with JAIDA from AidaProxy import * # create 1D and 2D cloud and plot them in hippoDraw h1 = Histogram1D("h1",“LogNormal Distribution",100,0,10) c2 = Cloud2D("MyCloud2", "Gaussian Distribution") # fill histograms with random gaussian points import random for i in range(0,5000) : h1.fill(random.lognormvariate(0,1)) xval = 1.*random.gauss(45., 10.) yval = 1.*random.gauss(60., 20.) c2.fill(xval,yval,1.) # create Plotter using JAIDA pl = pi_aida.Plotter() pl.createRegions(1,2) pl.region(0).plot(h1); pl.show() pl.region(1).plot(c2); pl.show()