Download
1 / 1
10 likes | 118 Views
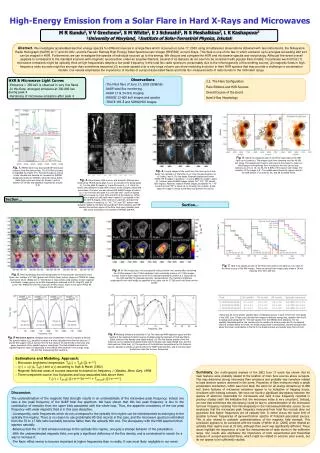
c. d. b. a. e. a. Fig. 4 . Eruptive feature 4. Fig. 1 . Hinode/XRT: eruptive feature 1. b. Fig. 5 . Accelerations of eruptive features (a) and peaks of the microwave burst (b). Fig. 2 . XRT: eruptive feature 2. Fig. 7 . NoRP total flux records (a–c) and turnover frequency (d).

E N D
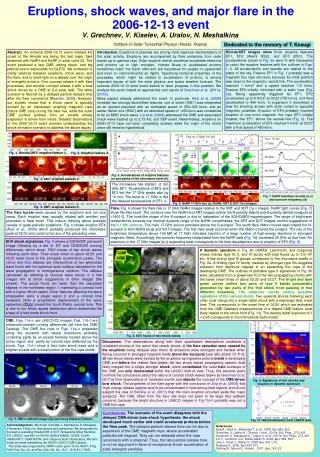
c d b a e a Fig. 4. Eruptive feature 4. Fig. 1.Hinode/XRT: eruptive feature 1. b Fig. 5. Accelerations of eruptive features (a) and peaks of the microwave burst (b). Fig. 2. XRT: eruptive feature 2. Fig. 7. NoRP total flux records (a–c) and turnover frequency (d) Fig. 6. NoRP 17 GHz flux (a), NoRH, XRT & SOT Ca II images. Fig. 3. XRT: eruptive feature 3. HiRAS Reg. 1 Reg. 2 Learmonth Culgoora Fig. 8. EUV traces of two shock waves. a b c 02:18:38 02:20:38 02:22:38 02:24:39 02:26:39 Type IV 02:54 03:06 03:30 d e f Fig. 9. Signatures of two shocks and eruption in dynamic spectrum Fig. 11. CME in LASCO/C2 images (top) and running differences (bottom) Fig. 10. Wave kinematics from LASCO data Dedicated to the memory of T. Kosugi Introduction. Eruptions of plasmas are among most vigorous manifestations of the solar activity. Eruptions are accompanied by flare emissions from radio waves up to gamma rays. Solar eruptive events somehow accelerate electrons and protons up to high energies. Intense fluxes of accelerated protons sometimes reach the Earth orbit and are hazardous for people on spacecraft and even on intercontinental air flights. Specifying temporal properties of the processes, which might be related to acceleration of protons, is among important issues of both the solar physics and space weather forecast. The extreme 2006-12-13 solar event seems to favor progress in this problem. We analyze this event based on approaches and results of Grechnev et al. (2011a, 2011b). Many papers already addressed this event. In particular, Asai et al. (2008) revealed two strongly blueshifted features, one of which (‘BS1’) was interpreted as an ejected plasmoid with an estimated speed of 250–300 km/s, and an earlier fainter one (‘BS2’) with an estimated speed of ~460 km/s was considered to be an MHD shock wave. Liu et al. (2008) addressed the CME and associated shock wave tracked up to 2.73 AU, and SEP event. Nevertheless, eruptions on 2006-12-13 have not been completely studied, while the origin of the shock wave still remains hypothetical. Hinode/XRT images show three eruptive features EF1, EF2 (Asai’s BS2), and EF3 (BS1). The accelerations shown in Fig. 5a were fit with Gaussians to catch the eruptive features with the outlines in Figs. 1–3. All accelerations and speeds are related to the plane of the sky. Feature EF1 in Fig. 1 probably was a magnetic flux rope structure, because its initial position was close to the magnetic neutral line. The acceleration reached 1 km/s2 and a speed reached 110 km/s. Feature EF2 initially coincided with a static loop (Fig. 2a). Being apparently triggered by EF1, EF2 accelerated up to 8 km/s2 at 02:23 (750 km/s), and then decelerated to 456 km/s. In expansion it resembled a bow for shooting arrows with ends rooted in opposite magnetic polarities. Eruption of EF2 probably inspired eruption of one more magnetic flux rope EF3 initially located, like EF1, above the neutral line (Fig. 3). The maximum acceleration of EF3 reached 5 km/s2 at 02:27 with a final speed of 420 km/s. Abstract. An extreme 2006-12-13 event marked the onset of the Hinode era being the last major flare observed with NoRH and NoRP in solar cycle 23. The event produced a fast CME, strong shock, and big particle event responsible for GLE70. We endeavor to clarify relations between eruptions, shock wave, and the flare, and to shed light on a debate over the origin of energetic protons. One concept relates it with flare processes, and another concept relates it with a bow shock driven by a CME at 2-4 solar radii. The latter scenario is favored by a delayed particle release time after the flare occurrence (Reames, 2009). However, our studies reveal that a shock wave is typically excited by an impulsively erupting magnetic rope (future CME core) during the flare rise, while the outer CME surface evolves from an arcade whose expansion is driven from inside. Detailed observations of the 2006-12-13 event promise understanding the shock formation scenario to address the above issues. Eruptions, shock waves, and major flare in the 2006-12-13 event The microwave rise started ~2 min after EF1. Accelerations of EF2 and EF3 led the 17 GHz peaks also by ~2 min. The burst at 17 GHz is like the delayed accelerations of EF1–3. Flare.Fig. 6 shows the flare rise in 17 GHz NoRH images relative to the XRT and SOT Ca II images. NoRP light curves (Fig. 7) show the flare burst. The contours over the NoRH and XRT images outline the N-polarity (black) and S-polarity (white) sunspots at 1400 G. The hook-like shape of the S-sunspot is due to ‘saturation’ of the SOHO/MDI magnetogram. The range of brightness temperatures exceeds the nominal dynamic range of the NoRH; nevertheless, the XRT and SOT images confirm suggestions of the 0.1 MK contours. The main 17 GHz source persisted above the S-sunspot. The south flare ribbon moved west toward the N-sunspot in both NoRH (d–g) and SOT images. The first main peak occurred when the ribbon covered the sunspot. The rise of the brightness temperature above 100 MK at 17 GHz indicates injection of a large number of high-energy electrons in strongest magnetic fields. Accordingly, the turnover frequency interpolated from the NoRP data (Fig. 7d) exceeded 35 GHz at that time. An extension in the 17 GHz images (d–i) expanding west corresponds to the flare development due to eruption of EF3 (Fig. 3). The flare bursts were caused by the eruptions and not vice versa. Each eruption was causally related with another and preceded a flare burst. This induce thinking about possible causes of quasi-periodic pulsations. Fig. 4 shows eruption EF4 (Asai et al., 2008) which probably produced the microwave peak at 02:33 and could not be any of the preceding ones. EUV shock signatures.Fig. 8 shows a SOHO/EIT pre-event image following by a set of EIT and GOES/SXI running differences, which show EUV traces of two shock waves following each other. Their onset times of about 02:23 and 02:27 were close to the strongest acceleration peaks. The yellow and blue ellipses are intersections of two spheroidal wave fronts with the spherical solar surface calculated for the wave propagation in homogeneous medium. The ellipses calculated by referring to obvious wave traces in a few images hint at shock suggestions in other images (the arrows). The actual fronts ran faster than the calculated ellipses in the northwest region 1 resembling a coronal hole with a higher Alfvén speed. Other features affecting the wave propagation were a plage region 2 and a coronal hole eastward. Note a progressive displacement of the wave epicenters (,) toward the South Pole’s coronal hole. This is due to the Alfvén speed distribution which determines the shape of a fast-mode shock front. A dynamic spectrum in Fig. 9b (HiRAS, Learmonth, and Culgoora) shows intense type III, II, and IV bursts with total fluxes up to 0.5106 sfu. A few strong type III groups correspond to the microwave peaks in Fig. 9a. A drifting type IV faintly masked by stronger type IIIs suggests emission from electrons trapped in an expanding flux rope of the developing CME. The outlines of probable type II signatures in Fig. 9b were calculated from a power-law fit of the two propagating shocks with the same onset times of about 02:23 and 02:27. The bright and dark green curves outline two pairs of type II bands presumably generated by two parts of the first shock front passing in two different streamers. The turquoise curves outline possible signatures of the second shock.Two upwards shocks following each other must merge into a single faster shock with a seemingly later onset time. This corresponds to the onset time of 02:30 which we estimated from the CME Catalog’s measurements of a fastest CME feature most likely related to the shock front (Fig. 10). The density falloff exponent of 2.65 corresponds to the mid-latitude Saito model. V. Grechnev, V. Kiselev,A. Uralov, N. Meshalkina Institute of Solar-Terrestrial Physics (Irkutsk, Russia) CME.Figs. 11a–c are LASCO/C2 images, Figs. 11d–f are enhanced-contrast running differences (all from the CME Catalog). The CME flux rope in Figs. 11a–c expanded along the streamer with lateral extensions probably consisting partly by an arcade formerly located above the active region and partly by coronal rays deflected by the shock. Figs. 11d–f show a faint halo shock trace and a brighter arcade with a small portion of the flux rope inside. Discussion. The observations along with their quantitative descriptions constitute a consistent picture of the event that clearly shows: i) the flare episodes were caused by the eruptions being delayed after them; ii) emissions were strongest and hardest when flaring occurred in strongest magnetic fields above the sunspots (see also poster S1-P-3); iii) two shock waves were excited by the eruptions as impulsive pistons inside a developing CME and before the related flare peaks; iv) two shock waves propagating upward most likely merged into a single stronger shock, which constituted the outer halo envelope of the CME and only decelerated within the LASCO field of view. Thus, this extreme event confirms the conclusions about the nature of coronal shock waves drawn by Grechnev et al. (2011a) from observations of moderate events and objects the concept of the CME-driven bow shock. The properties of the flare agree with the conclusion of Jing et al. (2008) that ‘high energy release regions tend to be concentrated in local strong field regions’ and do not support the idea of Sterling et al. (2011) that the main eruption occurred aside the major sunspots. The CME offset from the flare site does not seem to be large (the authors’ concern), because the bright structure in LASCO images in Fig.11d–f probably was not a CME flux rope. Conclusions.The scenario of the event disagrees with the delayed CME-driven bow-shock hypothesis: the shock developed much earlier and could accelerate protons before the flare peak. The delayed particle release time can be due to expansion of the CME magnetic rope, where accelerated particles are trapped. They can be released when the rope reconnects with a streamer. Thus, the late particle release time is not an argument in favor of exceptional shock-acceleration of solar energetic particles. Acknowledgments. We thank I.Chertok, L.Kashapova, K.Shibasaki, Y.Hanaoka, Y.Kubo for discussions and assistance. We are grateful to the teams operating Hinode/XRT & SOT; Nobeyama Solar Facilities; EIT, LASCO, and MDI on SOHO (ESA & NASA); GOES-12/SXI; HiRAS NICT, USAF RSTN, and Culgoora Solar Observatory. We also thank the team maintaining the SOHO LASCO CME Catalog. This study was supported by RFBR under grant 12-02-00037, Prog. RAS Pres. No. 22, and Rus. Min. Ed. Sci. (S.C. 16.518.11.7065). References. Asai A., Hara H., Watanabe T. et al.: 2008, ApJ 685, 622. Grechnev V., Uralov A., Chertok I. et al.: 2011a, Sol. Phys., 273, 433. Grechnev V., Afanasyev A., Uralov A. et al.: 2011b, Sol. Phys., 273, 461. Liu Y., Luhmann J.G., Müller-Mellin R. 2008, ApJ. 689, 563. Jing J., Chae J., Wang H.: 2008, ApJ 672, L73. Reames D.: 2009, ApJ 693, 812. Sterling A., Moore R., Harra L.: 2011, ApJ 743, 63.