Download
1 / 11
110 likes | 136 Views
Terrestrial Eco Test Tues. 9/24. Food Web Vocab Population Curves Symbiosis Levels of org Succession Tragedy of Commons Productivity All Graphs. 10% Rule Limiting Factors Dens dep vs Indep K vs r selected Types of Competition Alien vs Invasive vs Endangered Productivity.

E N D
Terrestrial Eco Test Tues. 9/24 • Food Web Vocab • Population Curves • Symbiosis • Levels of org • Succession • Tragedy of Commons • Productivity • All Graphs • 10% Rule • Limiting Factors • Dens dep vs Indep • K vs r selected • Types of Competition • Alien vs Invasive vs Endangered • Productivity
Species Gallery Walk Endangered Species Invasive Species Read each poster, explain the invasive species and what is being done to decrease high population size. • Read each poster, write cause of endangerment and what is being done to increase low population size.
Trophic Cascade • Addition or Removal of top predator causes major changes in lower trophic levels and abiotic factors in ecosystem
Keystone species • Organism whose niche is more significant than its population size • Foundation species or Ecosystem engineers – organisms who modify the habitat and thus benefit other organisms to use habitat • Ex. Corals, beavers, kelp
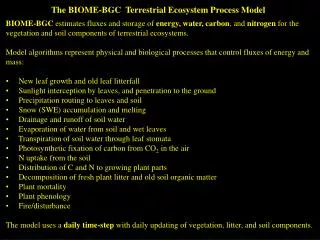
Ecosystem Productivity • Amount of energy available in ecosystem determines how much life the ecosystem can support
To calculate productivity: • Gross primary productivity (GPP)- total amount of solar energy that the producers in an ecosystem capture via photosynthesis over a given amount of time. • Net primary productivity (NPP)- The energy captured (GPP) minus the energy respired by producers. NPP = GPP – respiration by producers • Can measure CO2 produced and taken in
Example: Forest in N. America • GPP = 2.5 kg Carbon/m2/year • Respiration = 1.5 kg Carbon/m2/year • NPP = 1 kg Carbon/m2/year • Means plants in 1square meter of forest will add 1kg Carbon to body tissues every year (growth & reproduction)
Ecosystem Productivity • Producers typically capture only about 1% of available solar energy via photosynthesis. The energy they capture (GPP) can be divided into energy used for the producers’ respiration and energy available for the producers’ growth and reproduction (NPP).
How to estimate NPP • Mass of biomass of measured area • Biomass- the total mass of all living matter in a specific area • Standing crop- The amount of biomass present in an ecosystem at a particular time.
Energy Transfer Efficiency and Trophic Pyramids • This trophic pyramid represents the amount of energy that is present at each trophic level, measured in joules (J). While this pyramid assumes 10 % ecological efficiency, actual ecological efficiencies range from 5 to 20% across different ecosystems.