Download
1 / 54
540 likes | 667 Views
Determinants and Dynamics of Micronesian Emigration. A Brief Discussion for the Micronesian Voices in Hawaii Conference April 2008 Ben Graham. Outline. Foreword Guiding Questions Migration 101: What We Know WWII to Independence Micronesian Emigration Today The Numbers

E N D
Determinants and Dynamicsof Micronesian Emigration A Brief Discussion for the Micronesian Voices in Hawaii Conference April 2008 Ben Graham
Outline • Foreword • Guiding Questions • Migration 101: What We Know • WWII to Independence • Micronesian Emigration Today • The Numbers • Development Intentions • Issues and Indicators • Summary • Looking Forward
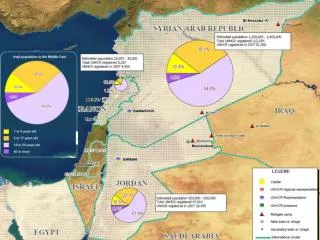
Foreword • Focus on: • international emigration (movement of persons out of one country and into another) • from the FSM and the RMI into the United States • “Micronesia” and “Micronesians” refer to FSM/RMI and their citizens (Palau and other countries in region not specifically discussed)
Guiding Questions • What are common drivers and characteristics of global migration? • What do we know specifically about Micronesian emigration over time? • What are key factors driving Micronesians to leave their islands today? • What are main social, economic, and other issues we must consider to better understand Micronesian emigration? • Looking forward, what are some important issues to consider?
Migration 101: What We Know • Humans have always migrated as a way to improve their condition • Micronesians in particular have (over thousands of years and out of basic necessity) always been highly mobile people • Today, global migration pressures continue to rise, mostly from the developing to the developed world • Every year, millions of emigrants from developing countries gain access into developed countries via formal and legal processes • Every year many enter illegally
Migration 101: What We Know • US alone sees nearly two million entrants a year, half a million of which are illegal • Earliest economic models for predicting emigration (at individual level) identified the following as major factors influencing decision: • Earnings at home • Potential earnings abroad • Cost of migration
Migration 101: What We Know • Over time, and with more research, more variables have been added. Common factors on sending country side include: • Poverty and hardship • Unemployment • Low wages • High fertility • Poor health and education services • Conflict, insecurity, violence • Governance issues • Human rights abuse, persecution, discrimination
Migration 101: What We Know • On the receiving side, major factors include: • Stock of previous emigrants from home country now residing in destination country (the “friends and relatives” effect) • Demand for labor • Potential for improved living standard • Safety and security • Political and religious freedom • Family reunification • Return to ethnic homeland • Freedom from discrimination and persecution
Migration 101: What We Know • In the middle, some factors can enable or deter the flow of migration from one country to another, namely: • Cost • Distance • Immigration policies In short, international migration is influenced by a wide and complex set of factors on the sending side, the receiving side, and in between. Emigration theories and models developed over the years can only partially explain and predict the emigration phenomenon.
Migration 101: What We Know • A simplified framework for studying migration
Migration 101: What We Know • A few other important characteristics of emigration: • Contrary to popular belief, emigration from poor countries typically increases as economic development in these countries takes place • There has been observed a hump-shaped curve reflecting the relationship between economic development and emigration • Migration (in general) can have profound effects on development, human capital accumulation, poverty, and many other issues in both sending and receiving countries • Internal migration (mostly in terms of urban migration) and migration between developing countries are also growing
WWII to Independence • 1950s and 1960s: Movement Strategically Denied • Post WWII years characterized by relatively limited movement of people into and out of Micronesia • US administration of TTPI emphasized control and security • US policy of strategic denial in force • However late 1960s saw entry of regularly scheduled airline services (Continental Micronesia) and Peace Corps
WWII to Independence • 1970s and 1980s: Emigration for Education Begins • Schools built in the 1950s and 1960s began graduating students in 1960s and 1970s • Emigration for education began in the 1970s • Most emigration out of Micronesia throughout the 1970s and 1980s was for education
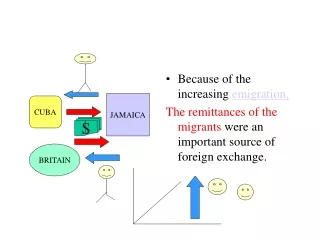
Micronesian Emigration Today • The 1986 commencement of the Compacts the defining moment in modern Micronesian emigration • Whereas education the initial driver, after 1986 we see a broadening of factors • Micronesians increasingly citing economic opportunity and employment as the key drivers • While 15.6 percent of post-Compact migrants in Hawaii in 1997 cited employment as their primary reason in 2003 this increased to 18.2 percent • Other drivers gaining importance: medical and subsistence • Arkansas Marshallese cite employment as #1
Micronesian Emigration Today Reason for Migrating (post-Compact migrants), Hawaii: 1997 and 2003 Source: Censuses of Micronesians in Hawaii.
The Numbers • Emigration has grown rapidly especially since beginning of the Compacts • But not unpredicted: • 1963 Solomon report “in the long run ... certain inflexible economic limitations of the area and the increasing population pressure must eventually compel substantial emigration of Micronesians.” • 1986 Fran Hezel “There is every reason to believe that the trickle of emigrants will increase considerably in the near future… Unless the island nations of Micronesia are somehow able to turn around their economies and create hundreds of new jobs without the assistance of higher levels of US aid, there is a good chance that more young people will elect to leave home and pursue jobs, wherever they are to be found.”
The Numbers • Neither FSM nor RMI have systems to capture emigration data • Recently discovered US Department of Transportation database captures all movements of airline passengers • Analyze air passenger movements into and out of Micronesian and US airports (embarkations and disembarkations) from the early 1990s to today • The following summarizes net embarkations (departures over arrivals) of air passengers over the 1991 to 2006 period • The data show very clearly: over 16 year period thousands more have departed than have arrived
The Numbers • FSM saw over 23,000 net embarkations while RMI saw over 15,000 • Chuuk 12,423 • Pohnpei 8,490 • Kosrae 1,187 • Yap 991 • While absolute numbers of FSM embarkations higher, RMI higher in percentage terms
Net Embarkations (by air) FSM and RMI: 1991 to 2006 Source: US Department of Transportation TranStats Database Note: data only for passenger movements between FSM/RMI and US, FY for FSM and CY for RMI
Net Embarkations (by air) FSM and RMI: 1991 to 2006 Source: US Department of Transportation TranStats Database Note: data only for passenger movements between FSM/RMI and US, FY for FSM and CY for RMI
The Numbers • For FSM, 1998, 2003, 2004, and 2006 banner years, with more than 2,000 total net embarkations • For RMI, 1995, 1997, 2000, 2001, 2005 and 2006 over 1,000 net embarkations • Next graph shows three year trailing averages for net embarkations for the 1993 to 2006 period • For FSM, since year 2000, average has been on an upswing (except for the slight dip in 2006) • For RMI, average was high in the early 2000s but has slowly leveled off
Net Embarkations (by air) FSM and RMI, 3-Year Trailing Average: 1993 to 2006 Source: US Department of Transportation TranStats Database Note: data only for passenger movements between FSM/RMI and US, FY for FSM and CY for RMI
Development Intentions • Generally speaking, development goals, intentions, and aspirations fairly clear: • Adopted similar strategies for development, prioritization on health and education sectors • Amended Compacts of Free Association prioritize resource allocations to health, education and supporting infrastructure • Pledged to promote sustainable growth by supporting and facilitating private sector development, efficient and effective basic public services, protecting and managing natural resources
Development Intentions • Both countries have held national economic and social summits • Both countries have formulated economic development plans • Both have signed onto multiple international treaties that commit them to achieving specific development goals and targets (MDGs) • But neither the FSM nor the RMI have very clear definitions of poverty and hardship and neither has articulated poverty alleviation or social protection strategy
Issues and Indicators Median Age: 1999-2000 Source: Secretariat of the Pacific Community PRISM website, census reports
Issues and Indicators Population Pyramids for RMI, FSM: 1999-2000 Source: Secretariat of the Pacific Community PRISM website, census reports
Issues and Indicators Average Household Size: 1999-2000 Source: census reports
Issues and Indicators • Both countries have rapidly growing working age populations (2006): • FSM 60,500 and RMI 28,900 • In the labor force: • FSM 35,400 and RMI 14,800 (historically low LFPRs) • Formally employed: • FSM 16,463 and RMI 9,810 (registered in the Social Security databases) • In some areas, formal employment has contracted over time
Issues and Indicators • Estimates for those in labor force but not registered as being formally employed: • FSM 18,978 and RMI 4,950 persons • These nearly 24,000 people are either: • Formally employed but not registered • Informally or self-employed • Not employed
Issues and Indicators Estimated Labor Force and Formally Employed: 1997 to 2006 Source: FSM and RMI Economic Reviews FY2006, author estimates
Issues and Indicators National Unemployment Rate: 1999-2000 Source: census reports
Issues and Indicators Average Annual Real Wages, Formally Employed: 1995 to 2006 Source: FSM Economic Review FY2006
Issues and Indicators • As with real wages, over the long run real GDP per capita in FSM and RMI has fallen • FSM real GDP per capita (1998 $) fell from $2,107 in 1995 to $1,888 in FY2006 • In RMI the decline (in 2000 $) from $2,693 to $2,454
Issues and Indicators Percent of Population Living Below Basic Needs Poverty Line: 1999-2000 Source: ADB Hardship in the Pacific series
Issues and Indicators • Participatory Poverty Assessments conducted in 2002 (for RMI) and 2004 (for FSM) by ADB • Conclusion: that while extreme poverty does not currently exist, many feel that hardship being experienced by many families in both urban and rural areas • Some families find it increasingly difficult to earn cash needed to meet living expenses • In 2006 RMI Community Survey, 27 percent of households indicated overall quality of life has gotten worse or much worse in recent years
Issues and Indicators Public Expenditure on Education (% of GDP): 2003 Source: IMF
Issues and Indicators Public Expenditure on Health (% of GDP): 2003 Source: IMF
Issues and Indicators Annual Average Per Capita Spending for Education/Health ($): 2005 Source: World Bank
Issues and Indicators World Health Organization Global Rankings on Overall Performance of Health Systems (191 countries): 2000 Source: WHO
Issues and Indicators Life Expectancy, Male and Female (from latest censuses) Source: Secretariat of the Pacific Community, PRISM website
Issues and Indicators Retention Rates, Grades 1,8,9,12 Source: World Bank and Hezel, F. (2002). Taking Responsibility for our Schools. PREL.
Issues and Indicators Is RMI Government (2006) Responsive to Community Needs? Source: 2006 RMI Community Survey
Summary • Young population structures = continued high growth in working ages, labor force • Micronesia will have excess labor supply for long time, but employment opportunities at home growing slowly • Unemployment and inactivity high, especially among youth • Real incomes have fallen since 1990s, many households below basic needs lines • FSM and RMI spend far more on health/education but much room for improvement • In governance, both countries can make improvements
Looking Forward • No reason to believe that magnitude of emigration will dramatically change any time soon - many push, pull, enabling factors at play
Looking Forward • PUSH: hardship, unemployment, low wages, limited education and health services, general lack of economic security, boredom – all will continue to push Micronesians • PULL: plentiful jobs, better wages, education opportunities, health services, growing pool of friends and relatives, prospects of improved living standards, economic security, citizenship, more US and other employers directly hiring from Micronesia (?) – all will continue to pull Micronesians • ENABLERS: open door access under Compact, friends and relatives covering emigration costs, short distances to some destinations (Guam, Honolulu)
Looking Forward • Some key questions and issues to also consider: • Is the open access under the Compact permanent? • What about companies now directly recruiting Micronesians from home (covering costs, etc.)? • What about climate change and sea level rise? • What about seasonal work schemes (e.g., Guam, Taiwan, etc.)? • What about growth in tourism? • What about remittances (financial, governance, etc.)? • Other issues?
Looking Forward • Both countries have promised to improve human development, economies, and quality of life • Some indicators confirm this is happening but most indicators suggest major improvements can be made, especially in health and education performance and outcomes • But improving health and education alone will not be enough • Economic policy commitments should translate into real economic and employment growth