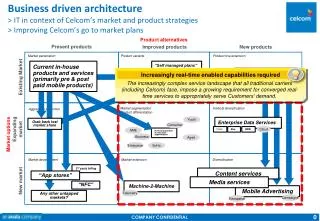
Lecture 3: PRODUCT DIFFERENTIATION
330 likes | 527 Views
Lecture 3: PRODUCT DIFFERENTIATION. AEM 4160: Strategic Pricing Prof. Jura Liaukonyte. Lecture Plan. Market concentration What does it mean How to measure Why do we care? HHI, CR4-Ratio, Lerner Index Product differentiation Differentiation and market structure Implications for pricing

Lecture 3: PRODUCT DIFFERENTIATION
E N D
Presentation Transcript
Lecture 3: PRODUCT DIFFERENTIATION AEM 4160: Strategic Pricing Prof. Jura Liaukonyte
Lecture Plan • Market concentration • What does it mean • How to measure • Why do we care? • HHI, CR4-Ratio, Lerner Index • Product differentiation • Differentiation and market structure • Implications for pricing • Price Discrimination • First Degree PD • Second Degree PD
Other Demand Elasticities • Income Elasticity of Demand • Measures how much quantity demanded changes with a change in income
Values for Income Elasticity (EI) • Sign indicates normal or inferior. • EI>0 implies normal good. • EI<0 implies inferior good. • Normal goods may be necessity or luxury.
Cross-Price Elasticity of Demand Measures the percentage change in the quantity demanded of one good that results from a one percent change in the price of another good Other Demand Elasticities
Other Demand Elasticities • Complements: Cars and Tires • Cross-price elasticity of demand is negative • Price of cars increases, quantity demanded of tires decreases • Substitutes: Butter and Margarine • Cross-price elasticity of demand is positive • Price of butter increases, quantity of margarine demanded increases
Example: The Cross-Price Elasticity of Demand for Cars • Source: Berry, Levinsohn and Pakes, "Automobile Price in Market Equilibrium," Econometrica 63 (July 1995), 841-890.
Magnitude Shows Size of Shift in Demand (Assume Psubst Increases) EXY>1 PX PX D’ D’ D D QX QX EXY<1
Price Elasticity of Supply • Measures the sensitivity of quantity supplied given a change in price • Measures the percentage change in quantity supplied resulting from a 1 percent change in price
MR = MC • Profit is p(q) = TR(q) - TC(q) • Profit maximization: dp/dq = 0 • This implies dTR(q)/dq - dTC(q)/dq = 0 • But dTR(q)/dq = marginal revenue • dTC(q)/dq = marginal cost • So profit maximization implies MR = MC
Monopoly (Cont.) Derivation of the monopolist’s marginal revenue $/unit Demand: P = A - B.Q Total Revenue: TR = P.Q = A.Q - B.Q2 A Marginal Revenue: MR = dTR/dQ MR = A - 2B.Q With linear demand the marginal revenue curve is also linear with the same price intercept Demand but twice the slope of the demand curve Quantity MR
Lerner Index • Lerner Index • L = (p - MC)/p = 1/|EP| • The higher the number, the more pricing power the firm has. • Mark-up power reflects monopoly power. • PUNCHLINE: If elasticity increases, mark-up will decline. If the product becomes less elastic, mark-up will increase.
Market Concentration • Industries have very different structures • Numbers and size distributions of firms • Ready-to-eat breakfast cereals: high concentration • Newspapers: low concentration • How best to measure market structure • Concentration ratio, • Herfindahl-Hirschman Index (HHI) • Lerner Index (LI) • Let’s look at each of them:
Four-Firm Concentration Ratio The sum of the market shares of the top four firms in the defined industry. Letting Si denote sales for firm i and ST denote total industry sales Herfindahl-Hirschman Index (HHI) The sum of the squared market shares of firms in a given industry, multiplied by 10,000: HHI = 10,000 S wi2, where wi = Si/ST. Industry Concentration
Measure of concentration Firm Rank Market Share Squared Market (%) Share • Compare two different measures of concentration: 1 25 625 2 25 625 3 25 625 4 5 25 5 5 25 6 5 25 7 5 25 8 5 25 Concentration Index
Measure of concentration Firm Rank Market Share Squared Market (%) Share • Compare two different measures of concentration: 1 25 25 625 2 25 25 625 3 25 25 625 4 5 5 25 5 5 25 6 5 25 7 5 25 8 5 25 H = 2,000 Concentration Index CR4 = 80
Concentration index is affected by, e.g. merger Firm Rank Market Share Squared Market (%) Share 1 25 25 Market shares change 625 Assume that firms 4 and 5 decide to merge 2 25 25 625 3 25 25 625 4 5 5 } } } 25 5 5 25 6 5 25 7 5 25 8 5 25 Concentration Index CR4 = 80 H = 2,000
Concentration index is affected by, e.g. merger Firm Rank Market Share Squared Market (%) Share 1 25 25 Market shares change 625 Assume that firms 4 and 5 decide to merge 2 25 25 625 3 25 25 625 4 5 5 } } } 25 100 10 5 5 25 6 5 25 7 5 25 8 5 25 Concentration Index CR4 = 80 H = 2,000
Concentration index is affected by, e.g. merger Firm Rank Market Share Squared Market (%) Share 1 25 25 625 2 25 25 625 3 25 25 625 4 5 5 } } } 25 100 10 5 5 25 6 5 The Concentration Index changes 25 7 5 25 8 5 25 Concentration Index CR4 = 80 85 H = 2,000 2,050
HHI • The Herfindahl-Hirschman Index – the square of the percentage market share of each firm summed over the largest 50 firms in the industry (or all of the firms if there is less than 50) • In perfect competition, the HHI is small • In monopoly, the HHI is 10,000 (100 squared) • A popular measure with the Justice Dept in the 1980’s • HHI < 1000 characterized competitive markets • HHI > 1800 would bring Justice Dept challenge to proposed mergers • E.g. The cigarette industry is highly concentrated with only 8 firms and a Herfindahl-Hirschman Index (HH1) of 2623
Candy v. Chocolate CANDY HHI (for top 4) = 1141 CR ₄ = 59% Medium level concentration ->Concentration is increasing! 1,039 businesses overall!! CHOCOLATE HHI (for top 4)= 2941.81 Cr ₄ = 78.1% High level of concentration 518 Businesses overall!!
CR₄ and HHI: Candy Industry • The HHI for just the top 4 companies in the industry is 2941.81. • The CR ₄ for the industry is 78.1%. • Therefore, the industry is highly concentrated with only a few major firms holding a majority of the market share. HHI = 49.5²+21.6²+4²+3²=2941.81 CR ₄ = 49.5 + 21.6 + 4 + 3= 78.1% *Hershey and Mars Inc. alone hold 71.1% of the market share. -Many mergers occur.
Market Definition • All Credit Lending Institutions with their own card • 27.2% J.P. Morgan Chase & Co. • 19.2% Bank of America Corporation • 18.9% Citigroup Inc. • 17.2% American Express Company • 4.0% Capital One • CR4: 83.2 • HHI: 1810-1850 • Total Number of Companies: 192
What is a Market? • No clear consensus • the market for automobiles • should we include light trucks; pick-ups SUVs? • the market for soft drinks • what are the competitors for Coca Cola and Pepsi? • With whom do McDonalds and Burger King compete? • Presumably define a market by closeness in substitutability of the commodities involved • how close is close? • how homogeneous do commodities have to be?
Fast-Food Outlets McDonald’s Wendy’s Burger King
Market Performance • Market structure is often a guide to market performance • But this is not a perfect measure • Can have near competitive prices even with “few” firms • Measure market performance using the Lerner Index P-MC LI = P
Lerner Index • L = (p - MC)/p = 1/|EP| • Lerner Index is bound between (0,1) • Closer to 1 the more pricing power the firm has. • Mark-up power reflects monopoly power. • PUNCHLINE: If elasticity increases, mark-up will decline. If the product becomes less elastic, mark-up will increase.
What are Sources of Monopoly Power? • Low elasticity of demand • We just showed this using Lerner Index. • Possibly due to strong product differentiation. • High barriers to entry • e.g., ownership of necessary raw materials, patents and regulatory barriers, scale economies, product diff. • Number of other competitors in market. • Interactions between firms: Compete or cooperate?
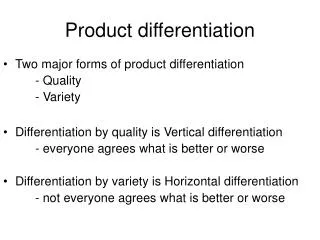
Product Differentiation Products are different if there is some objective characteristic or property, real or perceived, that provides a basis for buyers to choose one over the other. Product differentiation may lead to reduced own -price elasticity. As the degree of differentiation increases, the price elasticity will decrease.
Product Differentiation, cont. • Ways in which products are differentiated. • Product Brand • Packaging • Conditions of Sale • Service Provided • Location • Product Differentiation as an Entry Strategy • Product differentiation to create a niche market. • Product differentiation to deter entry.