Download
1 / 27
290 likes | 411 Views
Centennial Variation of the Global Monsoon Precipitation in the Last Millennium. Jian Liu Nanjing Institute of Geography and Limnology Chinese Academy of Sciences, Nanjing, China. Jian Liu Nanjing Institute of Geography and Limnology Chinese Academy of Sciences, Nanjing, China.

E N D
Centennial Variation of the Global Monsoon Precipitation in the Last Millennium Jian Liu Nanjing Institute of Geography and Limnology Chinese Academy of Sciences, Nanjing, China Jian Liu Nanjing Institute of Geography and Limnology Chinese Academy of Sciences, Nanjing, China Bin Wang University of Hawaii at Manoa, Honolulu Willie Soon Harvard-Smithsonian Center for Astrophysics, Cambridge Eduardo Zorita GKSS Research Center,Germany
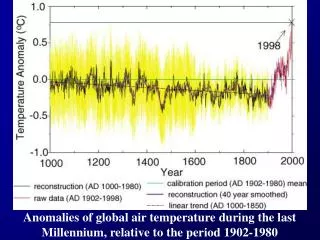
Background • Understanding multidecadal-centennial climate variability is essential for projection and attribution of climate change. But very little is known on this timescale. Global land monsoon rainfall decreases over the last 60 years based on observed data (Wang and Ding, 2008).
Background • Centennial-millennial variability has been studied mainly based on proxy data (tree ring, stalagmite, ice core, lake sediment, coral, historical document). Climate simulation is imperatively needed to explain its causes and mechanisms.
Outline • Motivation • Scientific Questions • Model and validation • Results • Conclusion Liu et al. Journal of Climate, 2009----Precipitation
Motivation • GM is a response of the global coupled atmosphere-land-ocean system to annual variation of the solar forcing. • GM precipitation (GMP) is a major water resource to more than two thirds of the world’s population. The future spatio-temporal change in GM precipitation is one of the deepest concerns worldwide. • The centennial-millennial variability of the GMP has not been studied. The characteristics, causes and mechanisms of the variability remain unknown.
Outline • Motivation • Scientific Questions • Model and validation • Results • Conclusion
Scientific Question • How does the GMP change on centennial-millennial timescale? • What factors give rise to these changes? • What physical processes are involved?
Outline • Motivation • Scientific Questions • Model and validation • Results • Conclusion
Model and validation ECHO-G Model ECHAM4&HOPE-GModel ECHAM4spectral atmospheric model, resolution T30 (3.75˚ x 3.75 ˚), 19 levels HOPE Gprimitive equation ocean model, equivalent resolution 2.8 ˚ x 2.8 ˚ with equatorial grid refinement, 20 levels Coupledthrough OASIS, flux correction
Model and validation Experiments Free (Control) run (CTL) driven by constant forcing of 1990 AD and integrated for 1000 years Forced run (ERIK) started in the year 900 AD with the initial conditions from the CTL. Spin up for 100 years and attain an equilibrated state around the model year 1000 AD. Then it was driven by three external forcing factors: solar variability, volcanic aerosols and GHG concentrations (CO2 and CH4) from 1000 to 1990 AD
Model and validation Effective Solar constant (W/m2) Year (AD) Forcings in ERIK run
Model and validation Validation of the model CMAP and NCEP-2 reanalysis data were derived for the period 1979-2004.ERIK was derived for the period 1965-1990 AD. The numbers shown in the upper-left corners and the lower-left corners indicate pattern correlation coefficients and root mean square errors with the CMAP data, respectively. ERIK simulated the annual mean precipitation and GM mode comparable to those captured by reanalysis.
Model and validation Validation of the model Comparison of the climatological annual mean precipitation rate (mm day-1) for (a) the observed (CMAP, 1979-2007), (b) ECHO-G model simulated (in the forced ERIK run, 1961-1990), and (c) the NCEP 2 reanalysis field (1979-2007). Pattern correlation coefficients and root mean square errors (in units of mm/day) with respect to the observation are shown in the upper-left (lower-bottom) corners of the panel (b) and (c).
Model and validation Validation of the model Comparison of the observed (CMAP, 1979-2007) and the simulated (ECHO-G ERIK and control runs, 1961-1990) climatological annual variation of precipitation rate (mm day-1) at (a) extratropical (36-50oN), (b) subtropical (21-35oN), and (c) tropical (6-20oN) East Asia averaged between 100oE and 120oE.
Model and validation Validation of the model F4 Comparison of the surface temperature variation of the proxy data (Yang et al. GRL, 2002) with ERIK simulated results. A 20-year average was applied to the time series.
Model and validation Validation of the model
Outline • Motivation • Scientific Questions • Model and validation • Results • Conclusion
Results Definition of Global Domain and Indices 1. AR of precipitation exceeds 2 mm/day 2. Local summer precipitation exceeds 55% of annual rainfall AR: MJJAS precipitation minus NDJFM precipitation in the Northern Hemisphere (NH) and NDJFM minus MJJAS precipitation in the Southern Hemisphere (SH). NHMI : JJA rainfall falling in NH monsoon domain. SHMI: DJF rainfall falling in SH monsoon domain. GMI=NHMI+SHMI
Results Time series of 7-year running mean GM indices (black lines). 31-year running means (red lines) highlight centennial-millennial variations Variation of Monsoon Indices
Results Periodicity of the GMI in the last millennium LIA (1450-1850): Weak GM Spörer Minimum (1460) Maunder Minimum (1685) Dalton Minimum (1800) MWP (1030-1240): Strong GM 1060;1150;1210 Periodicity: 192a 107a 74a Confidence: 99%
Results Attribution Smoothed (31-year running mean) time series from 1000 to 1990 AD of the effective solar radiation (a, W/m2), CO2 concentration (b, ppm), global mean temperature (c, K), global monsoon intensity (GMI) index (d, mm/day), global land-ocean temperature difference (e,K), global land-ocean sea-level pressure difference (f, hPa) and inter-hemispheric temperature difference (g, K). The numbers shown in the lower-right corners indicate the correlation coefficients of these factors with effective radiation forcing The spectrum of the GMI has pronounced peaks on 192, 107, and 74 years, which corresponds well to the significant spectral peaks from effective radiative forcing at around 192, 107, and 80 years.
Results Mechanism When effective radiative flux increases, the land warms more than the ocean, thus the thermal contrast between continent and ocean gets reinforced. The inter-hemispheric temperature difference varies in consistent with the effective radiative forcing. The reinforced thermal contrast further enhances the pressure differences between the land and ocean, thus strengthens the monsoon circulation and associated rainfall . Smoothed (31-year running mean) time series from 1000 to 1990 AD of the effective solar radiation (a, W/m2), CO2 concentration (b, ppm), global mean temperature (c, K), global monsoon intensity (GMI) index (d, mm/day), global land-ocean temperature difference (e,K), global land-ocean sea-level pressure difference (f, hPa) and inter-hemispheric temperature difference (g, K). The numbers shown in the lower-right corners indicate the correlation coefficients of these factors with effective radiation forcing
Results Attribution The effective solar irradiance in the late 20th century is 0.52 W/m2 lower than that during MWP, but the GM rainfall rate in the PWP is higher. Therefore, the solar and volcanic forcing can not account for most of the observed increase of GM precipitation in the 1961-1990. Rapid increase of atmospheric CO2 and CH4might have a positive contribution to the recent increase in the GM precipitation. Smoothed (31-year running mean) time series from 1000 to 1990 AD of the effective solar radiation (a, W/m2), CO2 concentration (b, ppm), global mean temperature (c, K), global monsoon intensity (GMI) index (d, mm/day), global land-ocean temperature difference (e,K), global land-ocean sea-level pressure difference (f, hPa) and inter-hemispheric temperature difference (g, K). The numbers shown in the lower-right corners indicate the correlation coefficients of these factors with effective radiation forcing
Outline • Motivation • Scientific Questions • Model and validation • Results • Conclusion
Conclusion(I) • The model results indicate that the centennial-millennial variation of the GM is essentially a forced response to the external radiative forcings. • Weak GM precipitation was simulated during the LIA (1450-1850) with three minima around the Spörer Minimum (1460), Maunder Minimum (1685), and Dalton Minimum (1800) periods of solar activity. Strong GM during the MWP (ca. 1030-1240).
Conclusion(II) • The GMI has pronounced bi-centennial and centennial variations. There is also a 70-80 year spectral peak. • Before the industrial period, the effective solar radiative forcing reinforce the thermal contrasts between the ocean and continent resulting in the centennial- millennium variation in the GM. • The prominent upward trend in GM precipitation occurring in the last 30 years (1961-1990) appear unprecedented and owed possibly in part to the increase of atmospheric carbon dioxide concentration.