Download
1 / 29
290 likes | 408 Views
Workshop Evidence on European Land Use / DG Regio Belgium. Understanding Land Use patterns in Europe – EU-LUPA project. Consortium. Netherlands. Netherlands. Sweden. Sweden. ALTERRA. ALTERRA. Ø. Ø. NordRegio. NordRegio. Ø. Ø. Poland. Poland. IGSO. IGSO. Ø. Ø. Spain. TECNALIA.

E N D
Workshop Evidence on European Land Use / DG Regio Belgium Understanding Land Use patterns in Europe – EU-LUPA project
Consortium Netherlands Netherlands Sweden Sweden ALTERRA ALTERRA Ø Ø NordRegio NordRegio Ø Ø Poland Poland IGSO IGSO Ø Ø Spain TECNALIA TECNALIA Ø Ø UAB ETC UAB - LUSI Ø Ø
EU-LUPA Project aim This project is about combining and aggregating land cover, land use and administrative data into meaningful typologies as potential input for policy making at European, national and regional level.
Working approach • What are the main characteristics of ongoing changes in land use and land use patterns? • To what extent and how are changes in land use patterns interacting with ongoing socio-economic developments? Can LUF help to analyse the land use patters? • How can typologies reflect on both levels of change, i.e. the physical characteristics of land use patterns, and the dynamics behind these changes? • Are the trends sustainable (performance and efficiency), and to what extent will the ongoing changes compromise future developments? Can LUF help to analyse the efficiency and sustainability of LU patters?
GEODATABASE CORINE LAND COVER Land use/cover (stock)) Land use/cover changes (1990-2006) Definition of LUF´s Comprehensive Regional Typologies Basic Regional Typologies Characterization: Socio-econ-amb indicators Pre-selection of case studies Dynamics and trends drivers LU Efficiency LU Performance Identification of Policy objectives Policy review Identification of Policy challenges & Trade-offs Guidelines & recomendations Case studies report + Validation in case studies
progress of the project Clustering of land use- Regional Typologies at NUTS3 Assessment of changes: static vs dynamic process Relation between land use changes and Land Use Functions
Impact of data availability • Determining typologies is highly dependent on the availability of data • At this moment three types of data are accessible • Corine status data for 1990, 2000 and 2006 • Corine change data for 1990 to 2000 and 2000 to 2006 • A variety of data characterizing the socio-economic situation in Europe • At this level of analysis the two first sets of data have been included in the analysis, and provide indications of what would characterize the possible typologies of land cover and land use
Impact of data availability • Consequently the two important characteristics of land cover are imperative for our analysis: • Data representing land use status, i.e. what is characterising the land cover situation at three different points of time, and out of that what are the static characteristics of land cover and land use • Data representing land use change, i.e. what is characterising the land cover and land use between the points of time when registration takes place, and thereby the dynamic characteristics of land cover and land use. • Due to this, our approach has its focus on the synthesizing of typologies representing as well status (static characteristics) and change (dynamic characteristics)
Characteristics of land cover status • Approach: Applying a two tier cluster analysis at the NUTS3 statistical level • Purpose: Ensuring that stable land cover characteristics over the 16 year time period is determined • Methodology: • For each of the three years a first level cluster analysis has been conducted, identifying regions characterized by the same land cover situations. • Based on the outcome of the clustering, 15 clusters have turned out to be advantageous. • The statistic characteristics of the clusters have been used in a second level cluster analysis, determining regions with similar land cover characteristics over the time perio.
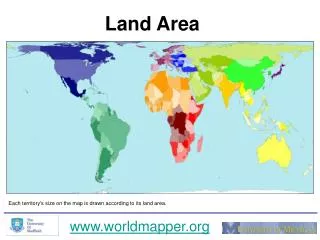
Characteristics of land cover status The regional characteristics of the final clusters are shown on the map. Due to limitations in data availability for some countries the analysis does not provide full coverage for Europe Due to the existence of extreme outlyers in the data material, the number of NUTS3 regions included in each cluster differs very much
Characteristics of land use change • Approach: Applying cluster analysis at the NUTS3 statistical level, one for each of the time period • Purpose: Ensuring that change characteristics as well as changes in these characteristics are shown in the analysis • Methodology: • For each of the two time periods a cluster analysis has been conducted, identifying regions characterized by the same land cover changes. • As there are marked differences in the process of land cover changes, an important issue has been not only to identify the changes, but also to show these time based differences • In order to keep the analyses comparable, the focus has been on percent changes per year
Characteristics of land use change • Sprawl of economic sites and infrastructures • In most of Europe it is an ongoing phenomenon during the whole period (yellow=low intensity, purple=high intensity) • There are, however, high intensity activities mostly during 1990-2000 (green colors) or 2000-2006 (blue colors)
Characteristics of land use change • Forest Creation and Management • This is the land cover change which has been among the most dominant in Europe during the period 1990 to 2006 • In several areas the changes has been ongoing throughout the whole period (yellow and purple) • The major pattern, however, is an intensification of the process after 2000 (blue)
Characteristics of land use change • Matrix of change 1990-2000 versus 2000-2006 • By means of colors both intensity and time period is shown on the map. • Colors yellow (low intensity) and Purple (high intensity) show changes which have been ongoing throught the whole period • Color green show changes which have been mainly ongoing during 1990-2000 • Color blue show changes which have mainly been ongoing after 2000
Characteristics of land use change • Dominating land use changes 1990 to 2006 • By means of a cluster analysis of changes in land cover characteristics the domination of the 9 basic change characteristics have been applied on Europe
Typology structure Artificial Surfaces Intensity Agricultural Land “Extensivity” Forest Land Water Bodies BASIS / MATRIX
Typology structure Artificial Surfaces Intensity Agricultural Land “Extensivity” Forest Land Water Bodies CHANGES
Preliminary Typology • Preliminary typology • Base color identifying the matrix: • Red = Artificial surfaces • Brown = Agriculture • Green = Forest areas • Blue = Water body areas • Color shades identifying the dominant change characteristics
Typology structure Artificial Surfaces Intensity/ MULTIPLE FUNCTIONS? Agricultural Land “Extensivity”/ MONO FUNTIONS? Forest Land Water Bodies
Why using Land Use Functions in EU-LUPA? Intensive Land Use intensity Time evolution Extensive Monofunctionality Multifunctionality Nr of land use functions
Why using Land Use Functions in EU-LUPA? • Changes based on CLC are too coarse to understand land use dynamics in EU27 • To assess the impacts of land use change in a comprehensive way and not based on the partial views provided by individual indicators: multi-criteria analysis • The Land Use Functions provide a way of enhancing understanding by: • Multi-functionality • Sustainability: integration of the economic, social and environmental dimension • Types of regions according to their dominant land use functions (patterns) and their changes in time (trends)
The LUFs method: aggregation scheme Basic aggregation scheme, after Paracchini et al. (2008). The symbols represent individual indicators contributing to more than one LUF
Test for the NL: Land Use Functions Changes in LUFS performance between 2000 - 2006 per NUTS 2 region LUFS performance per NUTS 2 region in 2000
GEODATABASE CORINE LAND COVER Land use/cover (stock)) Land use/cover changes (1990-2006) Definition of LUF´s Comprehensive Regional Typologies Basic Regional Typologies Characterization: Socio-econ-amb indicators Pre-selection of case studies Dynamics and trends drivers LU Efficiency LU Performance Identification of Policy objectives Policy review Identification of Policy challenges & Trade-offs Guidelines & recomendations Case studies report + Validation in case studies
Case studies • Aims: • To have a better understanding on the drivers and demonstrate the complex interrelated dynamics of land use patterns in the relation to contemporary policy, • To explain some processes in depth • To investigate in depth and assess land use multifunctionality • - To validate the proposed typologies
Working groups (35 minutes) • 1/ Introduction in each WG (5 minutes) • key ideas with regard to EU-LUPA approach (methodology-indicators / typologies / drivers-policies) • 2/ Round of interventions (20 min) ASK For CONCISE INTERVENTIONS • Answering some questions for debating specific “DRIVING IDEAS” of each WG: • 1st Round (10 min) • Is this part of the project understood? What are the main appreciations and critiques of this part of the project ? (e.g. drivers linked to patters in order to define policy recommendations framed under ESDP and TA) • 2nd Round (10 min) –or just open proposals if there is not enough time- • What would be the main advices and recommendations for further steps of the project? (in relation to the critiques, e.g. additional drivers not mentioned, structuring the policy recommendations in relation to LU competencies) • 3/ Facilitator outlines main conclusions (5-10 min) • before changing to the next WG (changing twice, everybody participating in the 3 WG)
GEODATABASE CORINE LAND COVER Land use/cover (stock)) Land use/cover changes (1990-2006) Definition of LUF´s Comprehensive Regional Typologies Basic Regional Typologies Characterization: Socio-econ-amb indicators Pre-selection of case studies Dynamics and trends drivers LU Efficiency LU Performance Identification of Policy objectives Policy review Identification of Policy challenges & Trade-offs Guidelines & recomendations Case studies report + Validation in case studies