Download
1 / 47
470 likes | 653 Views
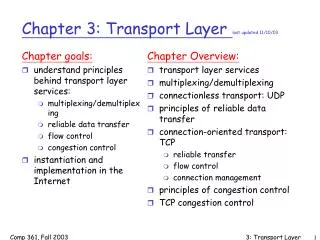
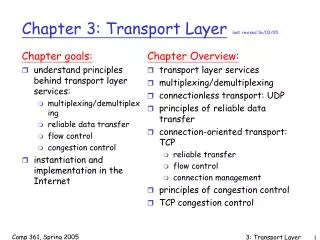
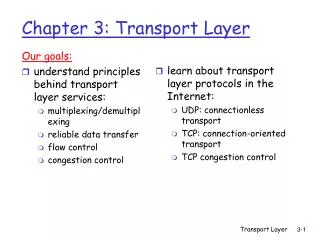
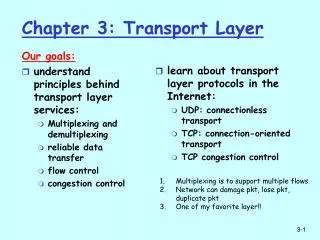
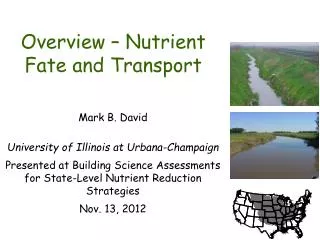
Overview – Nutrient Fate and Transport. Mark B. David University of Illinois at Urbana-Champaign Presented at Building Science Assessments for State-Level Nutrient Reduction Strategies Nov. 13, 2012. What I will cover. what the problem is

E N D
Overview – Nutrient Fate and Transport Mark B. David University of Illinois at Urbana-Champaign Presented at Building Science Assessments for State-Level Nutrient Reduction Strategies Nov. 13, 2012
What I will cover • what the problem is • N and P sources, balances, and river exports in the Mississippi River Basin (MRB) • Illinois as example • what is going to the Gulf • importance of modified hydrology (tile drainage) • timing of flow and nutrients; fate • myths; the challenge ahead
What is the problem? • both local and downstream water quality problems from nitrate and total P • local: algal production due to P; drinking water for N • downstream: hypoxia in the Gulf of Mexico • USEPA requiring nutrient criteria in flowing waters
What was new (in 2007, now old) • reaffirmed previous assessment • importance of spring (April, May, June) nitrate • now phosphorus recognized as having role in Gulf • no one answer to fix problem • both agriculture and people (sewage effluent) • recommended 45% reduction in N and P going down Mississippi River
County Level Analysis of Mississippi River Basin • counties in MRB (all 1768) • 1997 to 2006 annual data on fertilizer, crops, animals, people, deposition • predictive model from watersheds applied to all MRB counties • both N and P From David et al. (2010)
Nutrient Balances inputs + + - outputs - -
Annual N Fertilizer Applications Fertilizer (kg N ha-1) 0.0 - 11.2 11.3 - 27.2 27.3 - 45.4 45.5 - 65.9 From David et al. (2010) 66.0 - 107.1
Tile drainage is concentrated in the corn belt Fraction of county From David et al. (2010)
Net N Inputs (NNI) kg N ha-1 Some counties negative, N from soil mineralization
Linking N balances to N Export • hydrology overwhelming factor • channelization, tile drainage • can look at watershed N export as a fraction of net N inputs • most studies, about 25% • however in MRB we know it is larger in critical areas • can be > 100% in heavily tile drained watersheds
Modeled January to June Nitrate Export Best model includes fertilizer, sewage effluent, and tile drainage
Components of P Mass Balances • net P inputs = inputs – outputs inputs (fertilizer) outputs (grain harvest - human and animal consumption) • net indicates additions or removals from soil • little P (relative to N) is lost to streams, but it is biologically important • surface runoff and tile leaching • manure
Row Crop % Fertilizer P Net P Inputs Manure P From Jacobson et al. (2011)
Modeled January to June Total P From Jacobson et al. (2011)
P from fields to rivers – Embarras River From Gentry et al. (2007)
Particulate P from fields to rivers From Gentry et al. (2007)
Importance of a Few Storm Events From Royer et al. (2006)
Fate of N • limited in-stream losses of nitrate during high flow periods • Lake Shelbyville • Saylorville Reservoir • retention times too short • spring nitrate, headed to Gulf
Fate of P • some sediment removal • problem of sediment already in streams/rivers • stream bank, bed erosion • algal biomass can move downstream • no way to easily get out of system (like nitrate) Source: Clay Soil and Water Conservation District, Minnesota
What we know about nutrient sources • Upper Mississippi and Ohio subbasins are the major source of nitrate and total P • even more so in critical spring period • the tile drained cornbelt is clearly identified • mass balance of P has greatly decreased, but not N
What can we do in agriculture? • given, • it is not typically over fertilization based on current rates and yields • may be zero or negative N & P balances in some areas of the tile drained Midwest • three types of conservation practices could help • nutrient-use efficiency • in-field management • off-site measures
Perennial biofuels quickly reduce nitrate loss From Smith et al. (2013)
Point sources in MRB? • sewage effluent and industrial (22% of annual N and 34% of P) • however, only 14% (N) and 20% (P) of spring load • not going to solve problem, but could help for P
A few myths • no-till solves all problems • a few (bad) actors are the problem • over application of N (or P) is most of the problem • just targeting a few fields will solve most of the problem • edge of field denitrification can solve the problem • the response will take a long time (decades?)
What’s making it difficult • more corn (and fertilizer) • more intensive tile drainage • warmer winters • more intense winter/spring precipitation • fall N in Illinois, Indiana, Ohio • the intensity of agriculture across the cornbelt • many (most?) practices to reduce nutrient loss don’t increase yield
Conclusions • N and P balances don’t relate well to nitrate and P loss across the MRB (but could increase losses in a drought year) • counties with high fertilizer inputs have high crop fractions (& corn acres) and tile drainage • all lead to nitrate loss • corn & soybeans on tile drained land much more important than manure, deposition, or sewage effluent • P from both surface runoff and tiles • sewage effluent also important • high winter/spring flow and nutrient losses are a challenge, and seem to be getting worse
Job ahead for us • 45% reductions in N and P will be quite difficult in upper MRB • we haven’t really started • not in any meaningful way • variety of methods and costs • many or most unrelated to yields • scale of problem is impressive • but, we do know how to do it!