Download
1 / 19
190 likes | 331 Views
Warm-up. The mean grade on a standardized test is 88 with a standard deviation of 3.4. If the test scores are normally distributed, what is the probability that a person scored less than an 84?. Mean & Standard Deviation. Section 6.1B. Warm-up.

E N D
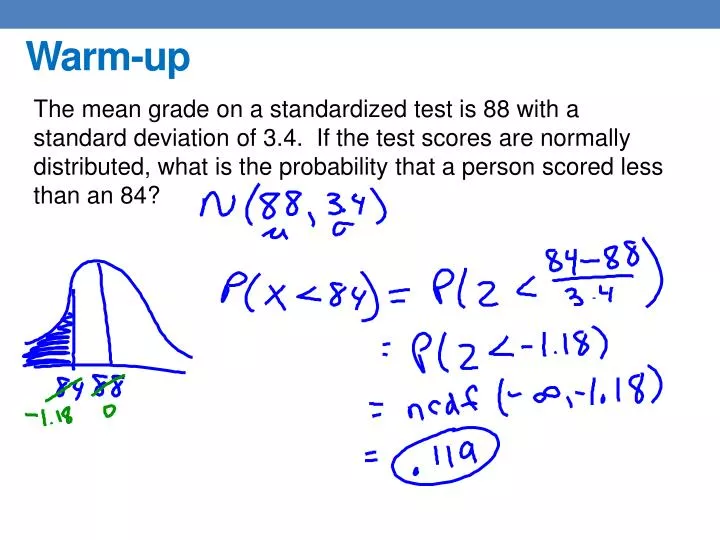
Warm-up The mean grade on a standardized test is 88 with a standard deviation of 3.4. If the test scores are normally distributed, what is the probability that a person scored less than an 84?
Mean & Standard Deviation Section 6.1B
Warm-up The probability that a person fails the 9th grade is 0.22. Let x = the number of people out of 3 who fail the 9th grade. Write the probability distribution of x.
Mean Value of Random Variable • Describes where the probability distribution of x is centered. • Symbol is • Where do you think the mean is located on the problem we did as a warm-up?
Standard Deviation • Describes the variation of the distribution. • Symbol is • If it’s small, then x is close to the mean. If it’s large then there’s more variability.
Formula • It’s also known as the Expected value and is written E(x).
Apgar scores – 1 min. after birth and again 5 min. Possible values are from 0 to 10. Find the mean.
What about the standard deviation? • How do you think we find it?
Ex. • Find the mean • Find the Standard Deviation • Find the probability that x is within one deviation from the mean.
500 raffle tickets are sold at $2 each. You bought 5 tickets. What’s your expected winning if the prize is a $200 tv.?
There are four envelopes in a box. One envelope contains a $1 bill, one contains a $5, one contains a $10, and one a $50 bill. A person selects an envelope. Find the expected value of the draw. What should we charge for the game for it to be fair?
A person selects a card from a deck. If it is a red card, he wins $1. If it is a black card between or including 2 and 10, he wins $5. If it is a black face card, he wins $10, and if it is a black ace, he wins $100. Find the expectation of the game. What would it be if it cost $10 to play? What should I charge to make it a fair game?
On a roulette wheel, there are 38 slots numbered 1 through 36 plus 0 and 00. Half of the slots from 1 to 36 are red; the other half are black. Both the 0 and 00 slots are green. Suppose that a player places a simple $1 bet on red. If the ball lands in a red slot, the player gets the original dollar back, plus an additional dollar for winning the bet. If the ball lands in a different-colored slot, the player loses the dollar bet to the casino. What is the player’s average gain?
Homework • Page 354 (9 – 12),15, 16, 18, 19, 28, 29, 30)