Download
1 / 25
270 likes | 479 Views
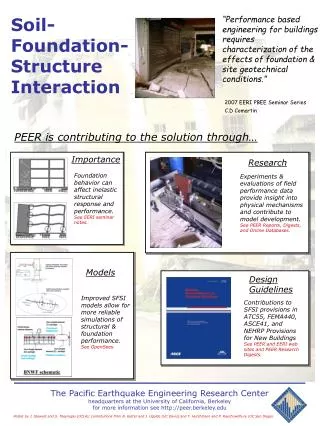
Millikan Library Demonstration Earthquake Engineering Research Laboratory. 2005 Preview November 10, 2005. Case Bradford case@ecf.caltech.edu http://ce.caltech.edu/case/. Overview. Dynamic characteristics of Millikan library Forced and ambient vibrations Changes in these characteristics

E N D
Millikan Library DemonstrationEarthquake Engineering Research Laboratory 2005 Preview November 10, 2005 Case Bradford case@ecf.caltech.edu http://ce.caltech.edu/case/
Overview • Dynamic characteristics of Millikan library • Forced and ambient vibrations • Changes in these characteristics • Weather patterns • Earthquake behavior • Structural Health Monitoring • Use changes in properties of the building to infer damage • Wave propagation / radiation damping • Applications to seismology
Robert A Millikan Memorial Library Millikan Library, one of the worlds most heavily researched and instrumented buildings, has been studied extensively since its construction in the 1960s. Very stiff 9-story reinforced concrete building with one basement. A synchronized vibration generator (“shaker”) is installed on the roof for forced vibration tests. USGS/Caltech Dense Instrumentation Network installed in 1998 -- 36 instruments, three horizontal accelerometers on each floor (from basement to roof) and three vertical accelerometers in the basement. California Integrated Seismic Network (CISN) station MIK installed in 2001. Three-component accelerometer on 9th floor.
Earthquake Movies Data from dense array.
24 Hours of Building Motions 24 hours of Millikan data from 9th floor station MIK -- Friday afternoon through Saturday afternoon Note the daily drift (instrument error) and the marked quiet period when the AC systems are turned off, daily, from 1:00-5:00AM Also note that there appears to be something interesting happening between 2:00PM and 4:00PM
Forced EW shaking with intermediate weights Forced EW shaking with full weights “People Power” - NS shaking Previous Demonstration… Here’s a quick summary of a demonstration from last year. For more information on forced vibration testing please refer to my website, ce.caltech.edu/~case
People Power Large excitations from the first five volunteers, and even larger when the entire group helped! The decay of the response with time when we stopped ‘shaking’ can be used to approximate the damping of the building.
…and take a FT to determine the frequency content, this represents the many sine curves you’d have to sum to obtain the original data. These two ways of looking at data contain the same information - you can switch back and forth between them if you need time-domain versus frequency domain information. What’s a Fourier Transform? So, take an arbitrary section of Millikan data…
EW1 T1 EW2 EW3 NS1 T1 NS2 Natural Frequencies From one day of ambient data, a Fourier Transform shows the fundamental frequencies of the library. The characteristics of the building (including these fundamental frequencies) change on several time scales.
Modeshape movies: EW Resonance at 1.1Hz
Modeshape movies: NS Resonance at 1.7Hz
Modeshape movies: Torsion Resonance at 2.4Hz
Historical Behavior of Millikan Library Fundamental EW and NS modes of Millikan Library since construction. Crosses indicate frequencies from forced vibration tests. Circles indicate estimates from recorded earthquakes. Dashed lines represent the observed natural frequencies of the library, and the shaded region is the likely variance from such factors as weather conditions, weight configuration of the shaker used for forced vibration tests, and experimental error. [ Earthquake Abbreviations: LC: Lytle Creek, SF: San Fernando, WN: Whittier Narrows, SM: Santa Monica, NR: Northridge, BH: Beverly Hills, BB: Big Bear ] (Clinton, 2004)
Days Years Weeks Dynamic Properties of Millikan Library vary on different timescales: Clinton, 2004
Spectrogram (Color Intensity Represents Variations in Amplitude) Spectrogram (Normalized by Peak Amplitude)
Forced Vibration Testing Big Bear Earthquake M5.4 D=119 22Feb2003 Santa Ana Windstorms
Big Bear Earthquake M5.4 D=119 22Feb2003 Forced Vibration Testing Santa Ana Windstorms
Weather Conditions Clinton, 2004 Heavy winds temporarily decrease all fundamental frequencies by 2-4%. The building recovers immediately after the wind event. Rainfall causes an increase in the EW and Torsional fundamental frequencies of 3-5%, the NS mode is less strongly affected by rain. Rain effects persist for 1-2 weeks, gradually reverting to pre-rain levels. When using the natural frequency of the building we have to account for these non-structural changes. A change of 5% in natural frequency corresponds to a 10% change in stiffness. Care must be taken when applying Structural Health Monitoring techniques that infer damage from changes in natural frequency.
J. Favela, 2004 Long Distance Studies
Long Distance Studies Finite element modeling of the Pasadena area -- excitation from our forced vibration tests J. Favela, 2004
Review • Vibrational characteristics of Millikan library • Mode shapes and natural frequencies • Forced vibration behavior • Changes in these characteristics • Weather patterns: Rain and wind cause large changes in stiffness • Earthquakes • Structural Health Monitoring • Traditional SHM techniques use changes in natural frequency to infer changes in stiffness, which is assumed to be from structural damage. We are working to refine these techniques. • Wave propagation / radiation damping