Download
1 / 36
360 likes | 569 Views
Human Population. Chapter 8 Environmental Science. The Central Case. China’s One-Child Policy How does the human population affect the environment?. Section 1. Objectives 1. Describe how technological advances have contributed to human population growth

E N D
Human Population Chapter 8 Environmental Science
The Central Case • China’s One-Child Policy • How does the human population affect the environment?
Section 1 • Objectives • 1. Describe how technological advances have contributed to human population growth • 2. Explain recent trends in population growth • 3. Identify characteristics of human population that are studied by demographics
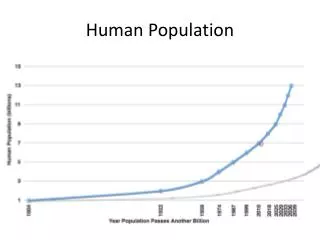
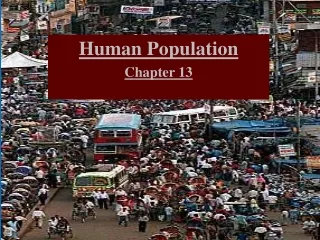
Section 1 • Human population has undergone tremendous growth that dwarfs all previous growth during our 200,000 years of existence. • The world population hit 1 billion about 1800, but now is about 6.8 billion as of 2010. • What is the largest population that Earth can sustain???.....
Section 1 • Agricultural Revolution • Around __________________ years ago human societies changed from ___________________ to _____________________. • Results: • 1. • 2 • 3 • 4
Section 1 • Industrial Revolution • Began in _________________ • Shift from _____________ life to ___________ life. • Led to these improvements: • 1. • 2 • 3
Section 1 • Sanitation • Louis Pasteur: • Things we learned: • 1. • 2. • 3. • 4.
Section 1 • Medical Technology • Things we learned: • 1. • 2.
Section 1 • Changes in Agriculture • Things that changed: • 1. • 2. • 3. • Real Data lab
Section 1 • Recent Trends in Human Population Growth • ________________ is the number of babies out of 1000 that die during their first year of life. • _________________ is the average number of years an individual is expected to live.
Section 1 • ______________ is how the population changes in size during a specific period of time. • Since the 1960’s the population rate has slowed from 2.1% to 1.2% • Rule of 72: divide 72 by the growth rate to determine how quickly a population will double.
Section 1 • Figure 4 • Growth rate varies by region – in fact some populations are actually decreasing. • Ex: Germany and Russia
Section 1 • Demography • The study of human population statistics is called __________________. • They use the same terminology we used earlier: • 1. • 2. • 3.
Section 1 • Population size • Changes every second • Population density • Global densities • Population densities are highest in regions with _____________________. • Population densities are lowest in regions with _____________________.
Section 1 • Population densities • _______________ are more densely populated than regions ___________________ • Regional densities • ___________________ are more densely populated than __________________ areas. • Population distribution • Human population is ____________ rather than _______________ or ___________________.
Section 2 • Objectives • 1. Describe total fertility rates and replacement fertility • 2. Explain how the age structure and sex ratio of a population define its potential for growth • 3. Describe the demographic transition • 4. Discuss social factors that affect population growth
Section 2 • Predicting population growth • Some scientists predict the world’s population may reach 9 billion by 2050……others project it could reach 10.5 billion by then. • That is a big range……..so how do demographers make theses predictions?????
Section 2 • Scientists use the same statistics ecologists use to describe ecological populations: • 1 1 2 3 4 • 2
Section 2 • Fertility rate • _______________ refers to the number of children a female member of a population has during her lifetime. • In the past the total fertility rate has been ___. • Recently it has _______ in many regions of the world • The total fertility rate for a nation that would keep its population size stable: ____________
Section 2 • Age Structure and Sex Ratios • Figure 9 • Quick Lab
Section 2 • The Demographic Transition • The shift from high birth rates and death rates to low birth rates and death rates • This is a 4-stage process • 1 • 2 • 3 • 4
Section 2 • Pre-industrial Stage • both death rates and birth rates are _______ • Why?? • These populations are not likely to see much ________________. • The Transitional Stage • Led by _________________ • Birth rates are ______, death rates ___________ • Population ____________
Section 2 • The Industrial Stage • Increases ___________ outside the home, especially for ______________. • ____________children are born. • Birthrates ______________ • Population growth ___________
Section 2 • The Post-Industrial Stage • Both birthrates and deathrates ____ • The population __________
Section 2 • Social Factors • What social factors affect a nation’s population growth???? • List them…..
Section 2 • These factors also affect a country’s population growth: • 1. • 2. • 3.
Section 2 • Developing Nations • Definition: • Tend to have higher ____________, ___________________, and _______________. • Life expectancy is ______________. • Reasons: ___________, ______________, ________________, _______________. • But, population growth of these nations _________ that of developed nations.
Section 2 • Developing countries • National policies: • 1. • 2 • 3 • 4 • Empowering women
Section 2 • Developed nations • Developed countries tend to have lower population growth, but they tend to have MUCH higher resource consumption. • 1 American can have as much environmental impact as 5 Chinese or 13 Pakistanis. • So, who is the bigger threat to the environment??????
Section 3 • Objectives • 1. Describe how humans impact their environments • 2. Discuss the negative and positive impacts of technology.
Section 3 • Impacts of population • Affluent societies • Tend to use more • 1 • 2 • 3 • 4 • Affluent countries tend to have higher _______________________.
Section 3 • Poor Societies • Put different stresses on their environment • Overwhelmed governments • Land overuse • Land clearing
Section 3 • The Wealth Gap • The difference between affluent countries and poor countries. • Leads to different social and environmental stress • Refers to the difference in assets and income between individuals or nations. • Figure 16
Section 3 • Quality of life • What determines quality of life?
Section 3 • Impacts of technology • Negative impacts • 1. • 2 • 3 • 4
Section 3 • Impacts of technology • Positive impacts • 1 • 2 • 3