Download
1 / 26
260 likes | 465 Views
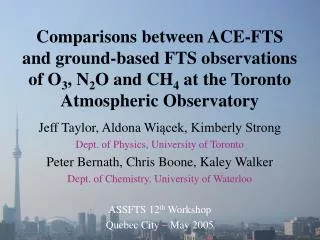
Comparisons between ACE-FTS and ground-based FTS observations of O 3 , N 2 O and CH 4 at the Toronto Atmospheric Observatory. Jeff Taylor, Aldona Wi ącek, Kimberly Strong Dept. of Physics, University of Toronto Peter Bernath, Chris Boone, Kaley Walker

E N D
Comparisons between ACE-FTS and ground-based FTS observations of O3, N2O and CH4 at the Toronto Atmospheric Observatory Jeff Taylor, Aldona Wiącek, Kimberly Strong Dept. of Physics, University of Toronto Peter Bernath, Chris Boone, Kaley Walker Dept. of Chemistry, University of Waterloo ASSFTS 12th Workshop Quebec City – May 2005
Outline Toronto Atmospheric Observatory • Facility and Instrument • Science Goals Retrievals • SFIT2 Retrieval Algorithm • Microwindows and Averaging Kernels Comparisons • Instruments and Measurement Coincidence • Relative Amounts and Bias
Toronto Atmospheric Observatory • Laboratory on the top floor of the 16-story Burton Tower at the University of Toronto • Bomem DA8high-resolution Fourier Transform infrared Spectrometer (FTS) • UV-visible grating spectrometer and Brewer Spectrophotometer • Suntracker (coupled to FTS) • Weather station (local T, p, RH, precipitation, winds, solar irradiance and UV radiation)
Fourier Transform Spectrometer • Nominal resolution: 0.004 cm-1 (OPD = 250 cm) • Infrared Spectral Region of 720-8500 cm-1 • Narrowband optical filters • Solar Absorption Spectra • Operational since October 2001
Bomem DA8 FTIR Spectrometer • New optical design - folding mirror is added to the moving arm of the interferometer and the fixed mirror is truly fixed in this design • Transfer optics coupling sun-tracker and FTS external port • External globar source • Internal globar & QH sources • KBr and CaF2 beamsplitters • InSb and MCT detectors • Operated under vacuum • Vibration-isolated
NDSC Filter Wavenumber cm-1 Wavelength m Chemical Species 1 4020 - 4290 2.33 - 2.49 HF 2 3000 - 3820 2.62 - 3.33 C2H2 HCN H2O & isotopes 3 2420 - 3080 3.25 - 4.13 CO2 H2O HDO HCl O3N2O CH4 NO2C2H6 4 2020 - 2570 3.89 - 4.95 OCS CO N2 5 1590 - 2150 4.65 - 6.29 NO COF2 6 670 - 1351 7.40 - 15 C2H2 C2H4 ClONO2 O3 N2O HNO3 NH3 CCl2F2 CHF2Cl 5 6 3 1 4 2 TAO – FTS Observation Capabilities
TAO – Science Goals • Stratosphere • Chemical, physical and radiative transfer processes underlying mid-latitude ozone budget • Network for the Detection of Stratospheric Change • Troposphere • Tropospheric constituents in an urban setting • Validation of Satellite Measurements • MOPITT (Dec 1999) • OSIRIS and SMR (Feb 2001) • SCIAMACHY, MIPAS, GOMOS (Mar 2002) • ACE-FTS and MAESTRO (Aug 2003)
Retrieval Algorithm • SFIT-2 Optimal Estimation Algorithm • A line-by-line calculation program for trace gas profile retrievals (developed by C. Rinsland, NASA Langley, and B. Connor, NIWA, New Zealand) • Auxiliary data (a priori VMR, p, T profiles; spectral absorption lines, surface p and T) establish a radiative transfer model and simulate a spectrum in a suitable microwindow • VMR profiles adjusted until simulated and measured spectra match within a specified convergence criterion
Sample Fits CH4 N2O O3
Instrument Comparison ACE-FTS on SCISAT • Observations throughout 2004 (version 2). • Partial columns of O3, CH4 and N2O from ~ 12 km up. • Latitude bin of 5 degrees. SCIAMACHY on ENVISAT • Observations in 2003 (WFM-DOAS – versions 0.4/0.41). • Total columns of CH4, and N2O. • 6 degrees longitude, 4 degrees latitude. OSIRIS on Odin • Observations from 2002 – 2005 (version 2.4). • Partial columns of O3. • 5 degrees longitude, 5 degrees latitude.
Averaging Kernels CH4 N2O O3
Relative Comparison Strategy Smoothing • Column concentrations were smoothed with TAO averaging kernels, following Rodgers and Connor, [JGR, 2003] Monthly Normalizing • Sort TAO data into monthly bins and normalize • Eliminates absolute comparison issues Relative Comparison • Compare to fitted trend • Eliminates temporal coincidence issues
Precision Error Estimate Statistical Error Estimate TAO Error Budget CH4 Total Column 1.0 % 2.4 % CH4 Partial Column 3.5 % 9.1 % N2O Total Column 0.4 % 1.4 % N2O Partial Column 3.6 % 4.6 % O3 Partial Column 2.0 % 4.5 %
CH4: TAO - SCIAMACHY BIAS = 0.4 % SCIA SCATTER = 4.5 %
CH4: TAO - ACE BIAS = 3.6 % ACE SCATTER = 3.7 %
N2O: TAO - SCIAMACHY BIAS = -5.0 % SCIA SCATTER = 9.7 %
N2O: TAO – ACE-FTS BIAS = -1.2 % ACE SCATTER = 6.6 %
O3: TAO – OSIRIS – ACE-FTS OSIRIS BIAS = 0.7 % SCATTER = 6.1 % ACE BIAS = 4.2 % SCATTER = 6.5 %
Conclusions • TAO-FTS observation comparisons were carried out with ACE, OSIRIS, and SCIAMACHY satellite instruments. • CH4 columns, and N2O partial column anomalies have no discernable bias beyond the precision measure of the TAO observations. • SCIAMACHY N2O total column anomalies appear to have a pronounced bias of ~ -5 % while ACE partial column O3 anomalies are ~4.2 %. • Future Work: • Further characterization of relevant errors (day-to-day) • Further comparison of these species with other satellite instruments. • Investigation of other species.
Acknowledgements • Instrument science teams: • OSIRIS: E. J. Llewellyn and the OSIRIS Science Team. • SCIAMACHY: Michael Buchwitz and Ruediger de Beek from the University of Bremen. • ACE: ACE Science Team and the University of Waterloo. • Toronto Atmospheric Observatory: • University of Toronto, CFI, NSERC, CRESTech, ABB Bomem, ORDCF, and PREA. • Special thanks to Tobias Kerzenmacher, Keith MacQuarrie, Rebecca Saari, Chris Avis, Brige Chugh, Nazlie Faridi, Oleg Mikhailov, and Dmitri Yashkov.