

ID1
E N D
Presentation Transcript
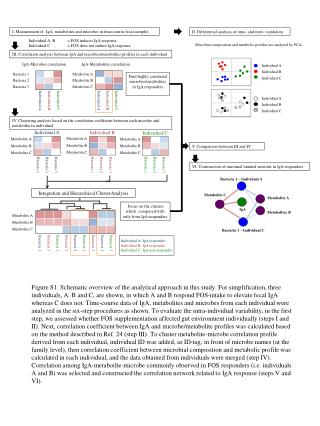
Figure S1. Schematic overview of the analytical approach in this study. For simplification, three individuals, A. B and C, are shown, in which A and B respond FOS-intake to elevate fecal IgA whereas C does not. Time-course data of IgA, metabolites and microbes from each individual were analyzed in the six-step procedures as shown. To evaluate the intra-individual variability, in the first step, we assessed whether FOS supplementation affected gut environment individually (steps I and II). Next, correlation coefficient between IgA and microbe/metabolite profiles was calculated based on the method described in Ref. 24 (step III). To cluster metabolite-microbe correlation profile derived from each individual, individual ID was added, as ID-tag, in front of microbe names (at the family level), then correlation coefficient between microbial composition and metabolic profile was calculated in each individual, and the data obtained from individuals were merged (step IV). Correlation among IgA-metaboilte-microbe commonly observed in FOS responders (i.e. individuals A and B) was selected and constructed the correlation network related to IgA response (steps V and VI).
ID1 ID2 ID3 ID4 Days Days Days Days ID5 ID6 ID7 Days Days Days Figure S2. The individual fecal IgA profile in time series. The fecal samples were collected more than 2 times during each period. Before intake FOS After intake
NS Figure S3. The comparison of Unifrac distance between “within” and “between” diet periods. P values were calculated using Mann-Whitney U test. NS, no significant difference.
A ID1 ID2 ID3 ID4 ID6 ID7 ID5 B ID1 ID2 ID3 ID4 ID6 ID7 ID5 Figure S4. Intra-individual profiles in time-dependent gut environment changes. (A) and (B) Score plots from PCA of fecal profile in individual samples are shaded by diet periods. (A) PCA on the fecal profiling data from microbiome analysis and (B) from metabolome analysis.
Table S1. The number of fecal samples used in this study and volunteers’ information. The number of fecal samples ID 1 2 3 4 5 6 7 Gender Female Male Female Male Male Male Female Age 23 30 25 22 23 25 30 Before FOS 2 3 3 2 4 3 2 During FOS 7 4 2 3 7 7 4 After FOS 2 3 2 2 2 2 2
Table S2. Summary of quality filtering of the 16S V1-2 sequences produced by 454 pyrosequencing of 7 healthy volunteers.
Table S3. Commonly correlated metabolites with IgA and microbes profile in FOS responders, ID4 and ID5. Highly correlated chemical shifts (ppm) and assigned metabolites with IgA and microbial tags commonly in ID4 and ID5 are listed. Multiple correlation analysis suggests the common metabolites may induce fecal IgA production by FOS supplementation.
Table S4. OTUs and assigned indigenous species showing 1 ≥ average reads in the microbial families highly correlated with IgA and metabolites in ID4 and ID5.
Table S5. Chemical shifts of fecal metabolites identified by NMR. Chemical shift (ppm) δ1H δ13C Multiplicity of 1H signal Code Metabolite assignment • Butyrate CH22.15 42.35 t • CH21.55 22.13 m • 2 L-lysine CH33.75 57.24 t • CH 3.00 41.94 t • CH 1.70 29.10 m • 3 L-phenylalanine CH 7.41 131.8 m • CH 7.36 130.6 m • CH 7.32 132.2 d • CH 3.98 58.93 dd • CH23.27 39.21 m • CH23.11 39.07 m • 4 Tyramine CH 7.24 132.1 d • CH26.89 118.9 d • p-cresol CH 7.16 133.6 m • CH 6.82 118.2 dd • Acetate CH31.91 26.09 s • Propionate CH22.17 33.47 q • CH31.04 12.98 t • Succinate CH22.40 36.88 s • Lactate CH31.32 22.26 d • L-Valine CH 3.59 63.11 d • CH 2.26 31.78 m • CH3 1.03 20.67 d • CH30.97 19.38 d • L-Leucine CH 3.73 56.24 m • CH21.72 42.62 m • CH21.71 26.91 m • L-Isoleucine CH 3.66 62.30 d • CH 1.97 38.66 m • CH21.45 27.32 m • CH30.99 17.48 d Letters indicate multipicity of the peak. s, singlet; d, doublet; dd, doublet of doublets; t, triplet; q, quartet; m, multiplet.