Download
1 / 21
240 likes | 466 Views
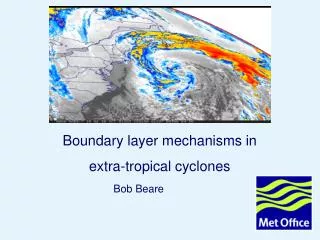
Boundary layer mechanisms in extra-tropical cyclones. Bob Beare. Motivation. Boundary layer significantly reduces the depth of a cyclone (~50% reduction in growth rates, Valdes and Hoskins 1988).

E N D
Boundary layer mechanisms in extra-tropical cyclones Bob Beare
Motivation • Boundary layer significantly reduces the depth of a cyclone (~50% reduction in growth rates, Valdes and Hoskins 1988). • Mechanism provides framework for understanding model changes. Drag Ekman pumping typically used at Met Office. • Conceptual models. • Recent research (Stephen Belcher, NWP seminar July 2005) indicates that potential vorticity (PV) should be considered also. Highlights warm sector and warm conveyor belt. • Aim: compare Ekman and PV approaches.
Boundary layer structure in extra-tropical cyclone Cold sector (unstable) Height L Potential temperature Warm sector (stable) Height Potential temperature
Ekman pumping Geostrophic wind Convergent wind u*=friction velocity h Coriolis Pressure gradient L u*2 Boundary layer stress drag Momentum balance & continuity L = horizontal scale f0=Coriolis parameter
Ekman pumping • Convergence from boundary layer drag ascent (Ekman pumping) spin down by vortex squashing • Distribution of friction velocity Ekman pumping • Weakness: momentum budget only, what about thermodynamics?
Potential vorticity Potential temperature gradient Absolute vorticity Conservation when no heating or friction Inversion (balance condition and boundary conditions) Potential temperature black, PV anomaly red, winds orange Increasing
Potential vorticity in boundary layer Boundary layer stress: Ekman pumping contribution Horizontal potential temperature gradients Heating from boundary layer: Surface heat fluxes All terms dependent on gradients in potential temperature. Weakness: what about regions with zero gradient of potential temperature (unstable layers)?
Summary Friction velocity Ekman pumping Coriolis paramter Horizontal scale Potential temperature gradient Potential vorticity Absolute vorticity
Model set up • Met Office Unified model • Idealised: dry, only boundary layer scheme and dynamics operating. • Why idealised? Isolate boundary layer-dynamics interaction, control over jets and sea surface temperature, framework for interpreting global model or NAE. • Met Office boundary layer scheme: separate treatment of stable and unstable boundary layers. • Limited area 18000 km x 9000 km, 45 km horizontal resolution, 10 minute time step.
Triggering cyclogensis Tropopause PV Upper level trough Near surface Potential temperature
Idealised UM cyclone lifecycle Warm seclusion Shading friction velocity > 0.5 m/s Cold conveyor belt jet (height 1 km)
Ekman pumping vs potential vorticity Boundary layer averaged PV in warm sector Ekman pumping max 9 cm/s
Distribution with stability Peak friction velocity in neutral/ unstable boundary layer PV confined to stable boundary layers h = boundary layer depth L= Obukhov length Unstable (cold sector) Stable (warm sector)
Summary • Ekman pumping and boundary layer averaged PV in distinct locations: the cold sector/ seclusion region (unstable) and warm sector (stable) respectively. • Which sector of the cyclone contributes the most to the cyclone depth? Next switch off boundary layer mixing in each region.
Switching off boundary layer mixing u*2 averaged over area of cyclone
PV inversion PV anomaly Horizontal section through domain
Comparison with global model Stable warm sector Idealised UM Global N216 Friction velocity>0.5 m/s shaded, solid 20 m theta, dashed divides between stable and unstable BLs
Sensitivity to “operational” boundary layer and dynamics changes Changes which affect the neutral boundary layer PS 10 changes (stability dependence) Interpolation in Semi-lagrangian scheme
Conclusions • Unified model has been set up with an idealised jet, forming a realistic cyclone lifecycle. • Ekman pumping and potential vorticity in different locations at occlusion: Ekman in cold sector/occlusion and PV in warm sector. • Switching off mixing in unstable boundary layer (cold sector/ occlusion) has more impact than for stable boundary layer (warm sector). • Operational type boundary layer mixing changes produce ~+/-2hPa change over 72 hours.
Future work • Invert warm sector PV to determine its impact on flow. • Harmonise PV and Ekman views via bottom boundary temperatures. • Revisit the role of the neutral boundary layer mixing on cyclones. • CASE studentship with Reading University: Ian Boutle.