Matrix Diagram
Matrix Diagram. Process Management & Innovation P05. Definition.

Matrix Diagram
E N D
Presentation Transcript
Matrix Diagram Process Management & Innovation P05
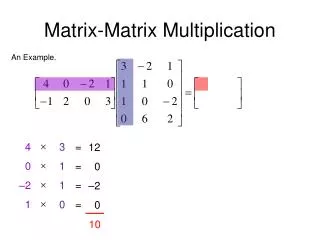
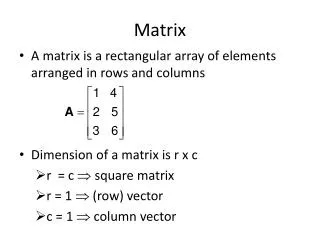
Definition A matrix diagram, also known as a Quality function deployment (QFD), is one of the Seven Management Tools that is used for identifying inter-relationships of the process or product variable that must be managed in the company’s plan . It is a grid by which you can used to analysis your materials to make comparison, selection or choice as it systemically organize a variety of data related to a process or product improvements.
Purposes The application of the Matrix Diagram is to • Assigned task to complete a project • Make a comparison between completing alternatives that involves a variety of characteristics • Prioritize combination of new and old activities that maximized the number of total objectives met. • Establish the relationship between the customer requirements and product features, where a number of product features may be combined to deliver the required customer benefit.
Types of Matrix Diagram • L-Shape Matrix Diagram • T-Shape Matrix Diagram • X-Shape Matrix Diagram • C-Shape or 3-dimensional Matrix Diagram • Inverted Y-Shape matrix Diagram
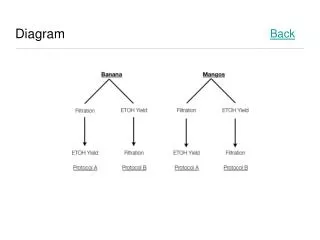
L-Shape Matrix Diagram Subcategories of 1 Variable Subcategories of 1 Variable Row Column The results shown on a completed diagram shows the possibilities of correlation between the subcategories listed.
Steps In Constructing A Matrix Diagram • Determine the factors that are important for making a correct selection • Brainstorm for any possible items and characteristics that can be compared and record down the information • Select the type of Matrix to be used (L-shaped, T-shaped, Y-shaped matrices…) • Identify or select the data to be investigated and write down the 1st set along the vertical axis of the matrix and the 2nd set along the horizontal axis of the matrix
Steps In Constructing A Matrix Diagram (Cont.) • Determine the relationship symbols to be used • Create a legend • Complete the proper matrix using the appropriate factors and symbols • Enter the appropriate symbol into each box • Examine the matrix and draw the appropriate conclusion
Case Study (An example) My parents work in an environmental chemistry laboratory and they want to assign their employees to several tasks. Their goal is to rid the confusion with distributing tasks to be done. The problem with their organization is to work is not distributed properly. One job had multiple employees, while another job was neglected. My dad will develop an L-shaped matrix diagram to organize and solve the current problem.
Primary responsibility Secondary responsibility Communication needed
End of Presentation Members Involved: Ken, Yong Shu, Sau Wen, Nick, Fadhilah, Dian, Doreen