Download
1 / 11
110 likes | 273 Views
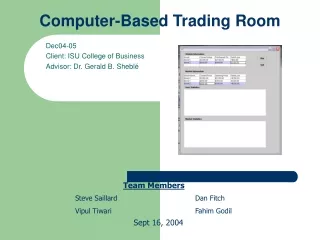
To help traders, regardless of their experience level, learn the importance of risk management, consistent trade execution and ultimately to become more profitable in the markets. We do this not only in our Live Futures Trading Room, but also with all of our membership options as they relate to effective Day Trading Strategies.

E N D
A day trading strategy that relies on simple trend following method uses tick charts where the tick bar completes after a specific number of trades, instead of the minute bar; by using tick charts you do away with time factor and instead add volume and volatility factor onto your bars. Use of the MACD indicator helps gauge market trends
26 for slow moving average.12 for fast moving average.9 for the moving average of the MACD – “the signal line”
The Bollinger bands as a second indicator helps to catch the strong trends and saves you from getting whipsawed in a sideways moving day trading strategy market and helps determined ‘entry signal’. The following settings for Bollinger bands are helpful:
The use of ADR helps you to determine the volatility of the market, and is measured by considering the seven day average of the difference in the highs and lows of the past seven days. Using ADR you can calculate your stop loss and profit target as follows:
When MACD crosses back below the signal line, while in an uptrend, and similarly if the indicator crosses above the signal line, while in downtrend, they are signals to get out of a trade immediately in case the trend reverses.
By trading on e-mini futures one is able to electronically trade futures contract that represent a percentage of a corresponding futures contract. It consists of round-the-clock trading and has low margin rates, volatility and liquidity. E-mini futures are a contract that reflects cash value of the underlying index on a specified future date. These contracts include indexes, commodities, metals and forex.
In futures trading the investors try to make a profit by buying at a lower rate and selling at a higher price in the future. It is basically a paper investment having an expiration date; however an investor can sell his contract before the expiration date. All contracts are standardized and hold a specified amount and quality of a commodity, for e.g. Gold contracts holds 100 troy ounces of 24 carat gold. Knowing how to trade futures is simple, there are two main types of traders known as the ‘hedgers’ and ‘speculators’. Hedgers are the producers of the commodity; speculators are those independent investors and floor traders who have no connection with the cash commodity and looks for a profit by purchasing a futures contract. An investor puts a small fraction of the actual commodity value, usually, around 10% as a security bond; his profits are 10 times higher the value of amount placed as margin if his predictions are correct and against him if he goes wrong in his predictions affecting his margin either slightly, wholly or even more. Results are quick as the futures markets moves faster than cash markets.