Download
1 / 22
220 likes | 242 Views
Learn how land use and natural controls impact habitat to shape biota conditions. Explore essential stream elements and monitoring protocols for assessing habitat indicators.

E N D
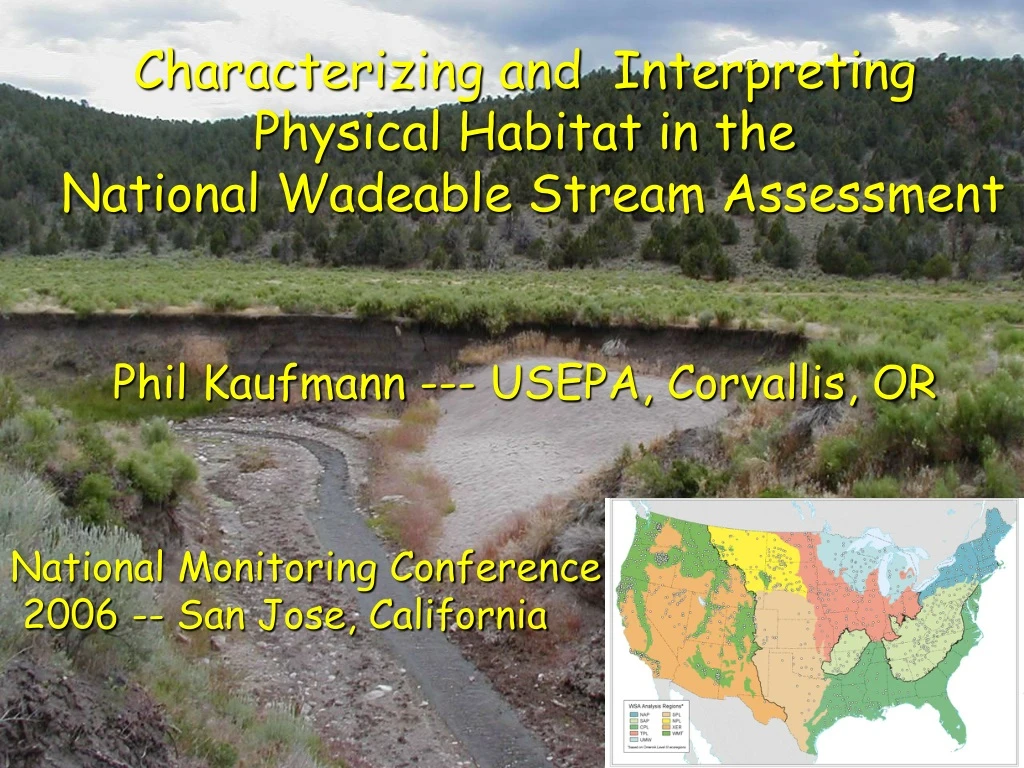
Characterizing and InterpretingPhysical Habitat in the National Wadeable Stream Assessment Phil Kaufmann --- USEPA, Corvallis, OR National Monitoring Conference 2006 -- San Jose, California
Primary interpretation of condition from biota, but land use and natural controls affect biota indirectly through their effect on habitat. Land Use Human Disturbance Natural Controls (stream size, elevation, slope) Physical Habitat Chemical Habitat Biological Condition
HABITAT... the set of conditions that support and control the distribution and abundance of aquatic organisms... • “Physical Habitat” restricts consideration to physical habitat structure • Includes some biological elements like vegetation that affect structure
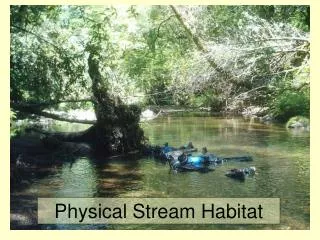
Essential Stream Physical Habitat Elements identified by a National Workshop of Experts: • Channel Dimensions • Gradient • Substrate • Complexity & Cover • Riparian Vegetation • Channel-Riparian Interaction • Anthropogenic Alterations • Flow Regime*
Sampling over a range of spatial scales Nation,Region Stream reach Micro-habitat Habitat unit
EMAP/NWSA Physical Habitat Protocol for Wadeable Streams • Randomized Reach Location • Length 40 x Wetted Width • Measurements spaced systematically • Several levels of resolution
EMAP/WSA Physical Habitat Protocol for Wadeable Streams • Long. Profile at 100 equidistant points: • Thalweg Depth, Surficial fines, Habitat Class • 21 Equidistant Cross-Sections: • Width, Substrate (105 particle “pebble count”) • 11 Equidistant Cross-Sections & Plots: • -- Channel Measures: Slope, Bearing, Channel Dimensions (wetted, bankfull, incision), Fish Cover, Canopy Cover, Substrate Embeddedness, Woody Debris Tally • -- Riparian Measures: Bank Character, Human Disturbance, Riparian Vegetation • Whole Reach: Channel Constraint, Flood/Torrent Evidence, Discharge near X-site
Habitat Indicators Reported in the National Wadeable Streams Assessment • Streambed Excess Fine Sediments --- scaling based on low end of RBS distribution in Ecoregional Ref Sites. • Habitat Cover Complexity --- Sum of all types other than algae and trash,etc, (XFC_NAT) scaled by Ecoregional Ref Sites. • Riparian Vegetation --- Density and Complexity meas’d by summed cover of 3 Layers of Woody Vegetation XCMGW – scaled by Ecoregional Ref Sites. • Riparian Disturbance--- Proximity-weighted human disturbance index (W1_Hall) -- values of 0.33 and 1.5 for low and high disturbance.
Relative Bed Stability and Excess Fines based on mean particle diameter ratio: Observed/Mobile LRBS=Log(Dgm/D*cbf) Observed Dgm --- geometric mean from field “pebble count”. D*cbf : max mobile D “Critical D” at bankfull --- by equating bankfull and critical shear stress: Bankfull Bed Shear Stress (pgR*bfS), controlled by: + Channel slope (S) + Adjusted Bankfull Hydraulic Radius (R*bf ) + Bankfull Depth, - Residual pool depth, - Form roughness,- Large wood volume Critical Shear Stress θ(ρs-ρ)gD, influenced by: + Particle Diameter (D) + mass density of particles in water (ρs-ρ) . shape, exposure, size variance, submergence, turbulence (θ)
Habitat Cover Complexitywood, brush, overhg’ vegetation, live trees, roots, undercut banks, boulders, rock ledges.
Riparian Vegetation • Vegetation Type and Cover: • - Canopy (>5m high) • - Mid-Layer (0.5 – 5m) • - Ground Layer (<0.5m) Riparian Disturbance • Proximity-weighted tally of human activities & disturbances
Habitat Indicator Criteria Values least and intermediate disturbanceFor 3 indicators: a percentile of ecoregional reference site distribution Ref sites disturbed Higher quality ref sites
Relative Bed Stability -- Excess Fines (low end of RBS) Region Least(Ref) Most Dist’d CPL > -2.4 * < -3.1* NPL > -2.0 < -2.6 SPL > -2.0 < -2.6 TPL > -2.0 < -2.6 UMW > -1.3 < -1.5 SAP > -0.6 ** < -1.2** NAP > -0.9 < -1.4 WMT-NRK > -1.1 < -1.8 WMT-PNW > -0.7 < -1.3 WMT-SW > -0.9 < -1.6 WMT-SRK > -0.6 ** < -1.3 XER > -0.9 < -1.7
Habitat Complexity (XFC_NAT) Region Least(Ref) Most CPL > 0.49 < 0.41** NPL > 0.31 < 0.17 SPL > 0.31 < 0.17 TPL > 0.25* < 0.18 UMW > 0.65** < 0.15 NAP > 0.35 < 0.25 SAP > 0.28 < 0.10* WMT-NRK > 0.34 < 0.18 WMT-PNW > 0.33 < 0.14 WMT-SW > 0.56 < 0.31 WMT-SRK > 0.37 < 0.10* XER > 0.27 < 0.13
Riparian Vegetation (3-Layer Woody Cover Sum: XCMGW) Region Least(Ref) Most CPL > 1.02** < 0.62** NPL > 0.49 < 0.27 SPL > 0.49 < 0.27 TPL > 0.35* < 0.21* UMW > 0.88 < 0.27 NAP > 0.90 < 0.50 SAP > 0.76 < 0.36 WMT (all) > 0.67 < 0.23 XER > 0.60 < 0.32
Riparian Disturbance (Proximity-weighted disturbance tally: W1_Hall) Region Least(Ref) Most Disturbed All NWSA < 0.33 > 1.5 0.33 would be 1 type of human disturbance observed within 10m of the stream at 1/3 of the 22 streamside plots 1.5 would be 1 type of human disturbance observed within the stream itself at all 22 streamside plots, or an average of 1.5 observed within 10m outside the stream.
Extent and Relative Risk of Stressors to Biological Condition Relative Risk relates stressor condition and biological condition by estimating the increased likelihood of poor biological condition when a given stressor is rated in poor condition. (This calculation treats each stressor independently and does not account for the effects of combinations of stressors.)
Streambed Sedimentation 45% of stream miles moderately or severely degraded by excess sedimentation Streams most disturbed by sedimentation have almost 250% greater risk of poor biological condition than streams least disturbed by sedimentation.
In-Stream Habitat Cover Complexity 45% of stream miles have moderate to severely degraded in-stream fish habitat. Streams rated poor for in-stream habitat have about 40% greater risk of poor biological condition.
Riparian Vegetation (Cover Complexity) 47% of stream miles have moderate to severely degraded vegetation cover complexity in riparian zone. Streams rated poor for riparian vegetation have about 60% increased risk of poor biological condition.
Human Influence in Riparian Zone 73% of stream miles have moderate to high amounts of streamside human influence. Streams rated poor for human influence have 45% greater risk of being in poor biological condition.
Challenges for Future Assessments: Hydrologic Alteration, which can result from:-Change in precipitation or runoff - Water withdrawal or augmentationChannel Incision – a result of increase in sediment transport relative to sediment supply:-Increase in storm flows? - Decrease in bed and bank stability? - Decrease in sediment supply or size ? - Change in channel slope/sinuosity/roughness ?