Download
1 / 71
710 likes | 814 Views
Explore the marine protein contribution to the food supply, benefits of consuming marine proteins, and economic opportunities. Learn about seafood's role in meeting global food needs and the potential benefits for human health. Understand the current global food situation, energy requirements, and projections for future food demand and supply. Discover the ecosystem and trophic levels involved in food production and the limits to terrestrial and aquatic production methods. Consider the importance of aquaculture and the challenges faced in the fishing industry.

E N D
Contributions of the Aquatic Environment to the Global Food Supply Karl D. Shearer Aquaculture Protein Centre Dept. of Animal and Aquacultural Sciences Norwegian University of Life Sciences Ås Norway NHL Oslo 29 November 2012
Three Questions from Stein Ove Østvik • The contribution of marine protein to the global food supply 2. The benefits of consuming marine proteins 3. Economic opportunities for marine proteins
1 The contribution of seafood to global food supply
Human Food RequirementsforEnergy and Protein Average per Person Energy 2500 kcal/day Protein 55 g Johansson et al., AMBIO (2010)
Global RequirementsforEnergy and Protein Annual needs of 6.7 billion people in 2010 Energy 7092 TWh Protein 134 Mt Johansson et al., AMBIO (2010)
Global Food Energy Budget Johansson et al., AMBIO (2010)
Human Food Energy Needvs. Supply In 2010 we could feed 8.7 billion Johansson et al., AMBIO (2010)
We can conclude that, at present, we have enough food to feed the global population. Malnutrition (one billion people) is due to poverty.
FAO Global Food Price Index Lagi et al., 2011
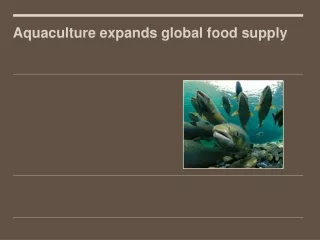
Increasing Food Demand The Food and Agriculture Organization (FAO) projects that a 70% increase in the food supply will be required by 2050 Due to an increase in population and an increase in meat consumption
Human Food Energy Demand Johansson et al., AMBIO (in Press)
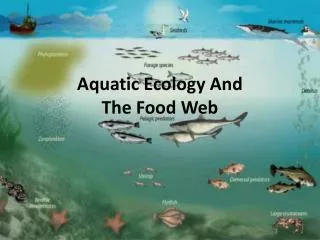
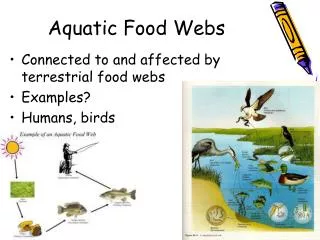
Ecosystems and Trophic Levels Terrestrial Aquatic Microbes Bacteria Yeast Carnivores Carnivores Herbivores, Omnivores Herbivores, Omnivores Algae, Plants Plants Sun, Water, Soil, Nutrients Sun, Nutrients
Terrestrial Crop Production Herbivores, Omnivores Plants Sun, Water, Soil, Nutrients
Global Crop Production 2010 FAO Food Outlook, Nov 2012
Limits to Terrestrial Plant Production Arable land is limited Topsoil loss Water is limited Phosphorus and potash Salinization
Terrestrial Meat Production Terrestrial Carnivores are missing Herbivores, Omnivores Plants Sun, Water, Soil, Nutrients
Global Meat Production 2010 FAO Food Outlook, Nov 2012
Limits to Terrestrial Animal Production Feed costs Ethical considerations
Aquatic Plant Production Carnivores Herbivores, Omnivores Algae, Plants Sun, Nutrients
Wild Aquatic Plant Harvest Harvest of aquatic plants is about 3.5 Mt wet weight The majority is consumed directly
Aquatic Meat Production Carnivores Herbivores, Omnivores Algae, Plants Sun, Nutrients
Trends Growth in Global Fish Production Aquaculture 1981- 1990 1991- 2000 Capture 2001- 2010 2011- 2020
Limits to Harvest of Wild Marine Resources Over fishing Climate change Pollution Ocean acidification Introduced species
Aquaculture Carnivores Herbivores, Omnivores Algae, Plants Sun, Nutrients
Global Aquaculture Production 2009 Total = 73 Mt FAO, 2011
Classification of Aquaculture Trophic levelDegree of Control Plants Extensive Herbivore Extensive Omnivore Semi-intensive Carnivore Intensive Concentrated Aquatic Animal Feeding Operation (CAAFO)
Global Aquaculture Production 2009 FAO 2011
2 The benefits of consuming marine proteins
Seafood and Human Health • The benefits and risks of seafood consumption • are examined: • Measuring the levels of nutrients and known risk factors • In a clinical trial (short term, variables, mechanisms)) • 3. An epidemiological study (long term, associations)
Measuring Seafood Composition NIFES National Institute of Nutrition and Seafood Research Nutrient Composition of Seafood Undesirable Substances
Clinical trial An Example (A) Increased Omega-3 intake reduces (B) Blood triglycerides (B) Reducing triglycerides improves (C) Cardiovascular health Therefore (A) Increased Omega-3 intake improves (C) cardiovascular health
Clinical Trial (A) Increased Omega-3 intake reduces (B) Blood triglycerides (B) Reducing triglycerides may improve (C) Cardiovascular health Therefore (A) Increased Omega-3 intake may improve (C) Cardiovascular health Rizos, E. C. et al., Association Between Omega-3 Fatty Acid Supplementation and Risk of Major Cardiovascular Disease Events: A systematic Review and Meta-Analysis. Sept 2012. 308 (10) 1024-1033. No reduction in cardiovascular outcomes and omega-3 supplementation
Clinical Trials Correlation vs. Causation We need to understand the mechanisms e.g. How do omega-3s affect cardiovascular health?
Epidemiological Study Searching for correlations Between variables
Chowdhury, R. et al. BMJ 2012; 345Association between fish consumption, long chain omega 3 fatty acids, and risk of cerebrovascular disease: systematic review and meta-analysis Meta-analysis 38 studies 794,000 people People consumed fish 0 or 1 times/week 2-4 times/week 5 or more times/week
Input Variables A1, A2, A3 A1 A2 A3
Statistics Examine the correlation between the input variables A1, A2, A3 and the response in Variable C (Incidence of stroke)
Results of the Analysis The were a total of 34817 strokes (C) A3 Fish 0-1 times/week 12057 strokes A2 Fish 2-4 11334 -6% A1 Fish 5 or more 10610 -12% 34817
Conclusion Eating fish reduces strokes Control
The Alternative Explanation A1 A2 A3 Control
Contaminant free seafood is a good source of nutrients,butmany studies examining the benefits or risks of consuming seafood have flaws and that additional studies are required. Seafood and Human Health