Download
1 / 1
20 likes | 236 Views
Acknowledgments. . Blood Pressure Monitor Re-Calibration Lei Qu 1 , Ross Hamilton 1 ,David Lee 1 , Haniff Mohd Nor 2 Advisor: Dr. Andre Churchwell 3 , Dr. Paul King 1.

E N D
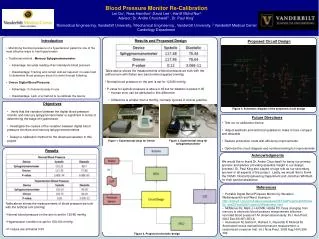
Acknowledgments . Blood Pressure Monitor Re-Calibration Lei Qu1, Ross Hamilton1,David Lee1, HaniffMohd Nor2 Advisor: Dr. Andre Churchwell3 , Dr. Paul King1 1Biomedical Engineering, Vanderbilt University, 2Mechanical Engineering , Vanderbilt University, 3 Vanderbilt Medical Center Cardiology Department • Introduction • Monitoring the blood pressure of a hypertension patient is one of the most effective ways to treat hypertension • Traditional method - Mercury Sphygmomanometer: • Advantage: Accurate reading of an individual’s blood pressure • Disadvantage: Training and certain skill set required; it is also hard to determine blood pressure since it is done through listening. • Omron Digital Blood Pressure: • Advantage: Convenience/easy to use • Disadvantage: Lack of a method to re-calibrate the device Results and Proposed Design Proposed Circuit Design . • Table above shows the measurements of blood pressure we took with the artificial arm with flatten arm band method applied (mmHg) • Normal blood pressure on the arm is set for 120/80 mmHg • P-value for systolic pressure is above 0.05 but for diastolic is below 0.05 • Human error can be attributed in this difference • Difference is smaller than 2 mmHg, normally ignored in clinical practice • Objectives • Verify that the variation between the digital blood pressure monitor and mercury sphygmomanometer is significant in terms of determining the stage of hypertension • Investigate the causes of the variation between digital blood pressure monitors and mercury sphygmomanometers • Design a calibration method for the observed variation in this project Figure 4. Schematic diagram of the proposed circuit design Future Directions • Test our re-calibration device • Adjust aesthetic and technical qualities to make it more compact and desirable • Reduce production costs with efficiency improvements • Optimize the circuit diagram and continue testing for improvements Figure 1. Experimental setup for Omron Figure 2. Experimental setup for sphygmomanometer Results We would like to thank Dr. Andre Churchwell for being our primary sponsor and advisor providing essential insight to our design process! Dr. Paul King also played a huge role as our secondary sponsor in all aspects of the project. Lastly, we would like to thank the VUMC Clinical Engineering Department and Jonathan Whitfield for their special assistance. References • Portable Digital Blood Pressure Monitor by WoradonWattanapanitch and WarutSuampun http://instruct1.cit.cornell.edu/courses/ee476/FinalProjects/s2005/ww56_ws62/Final%20Project%20Web/index.html • McManus RJ, Mant J, Hull MR, Hobbs FD. Does changing from mercury to electronic blood pressure measurement influence recorded blood pressure? An observational study. Br J Gen Pract. 2003 Dec;53(497):953-6. • Heinemann M, Sellick K, Rickard C, Reynolds P, McGrail M. Automated versus manual blood pressure measurement: a randomized crossover trial. Int J NursPract. 2008 Aug;14(4):296-302. • Table above shows the measurements of blood pressure we took with the artificial arm (mmHg) • Normal blood pressure on the arm is set for 120/80 mmHg • Hypertension condition is set for 150/100 mmHg • P-values are all below 0.05 Figure 3. Proposed schematic design


![get✔️[PDF] Download⚡️ Blood Pressure Log Book: This blood pressure logbook with blood pres](https://cdn7.slideserve.com/12924600/blood-pressure-log-book-pulse-record-monitor-dt.jpg)