Inventory
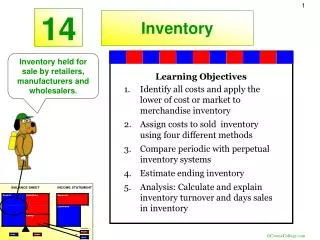
Learn about inventory management, types of inventory, reasons to hold inventory, inventory costs, control systems, EOQ model, production quantity examples, safety stock, and aggregate production planning.

Inventory
E N D
Presentation Transcript
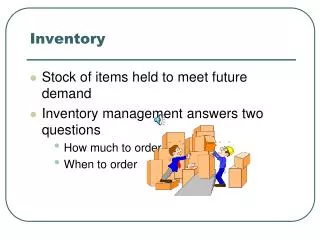
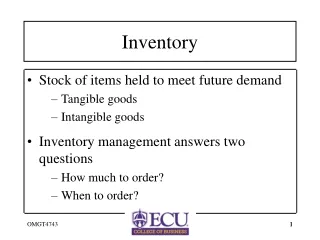
Stock of items held to meet future demand Tangible goods Intangible goods Inventory management answers two questions How much to order? When to order? Inventory
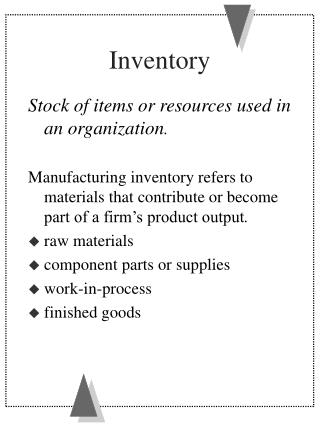
Raw materials Purchased parts and supplies Labor In-process (partially completed) products Component parts Working capital Tools, machinery, and equipment Finished goods Types of Inventory
Meet unexpected demand Smooth seasonal or cyclical demand Meet variations in customer demand Take advantage of price discounts Hedge against price increases Quantity discounts Reasons To Hold Inventory
Dependent items used to produce final products Independent items demanded by external customers Two Forms Of Demand
Carrying Cost cost of holding an item in inventory Ordering Cost cost of replenishing inventory Shortage Cost temporary or permanent loss of sales when demand cannot be met Inventory Costs
Fixed-order-quantity system (Continuous) constant amount ordered when inventory declines to predetermined level Fixed-time-period system (Periodic) order placed for variable amount after fixed passage of time Inventory Control Systems
Demand is known with certainty Demand is relatively constant over time No shortages are allowed Lead time for the receipt of orders is constant The order quantity is received all at once Assumptions Of Basic EOQ Model
Demand rate Order qty, Q Inventory Level Reorder point, R Lead time Lead time 0 Time Order Placed Order Received Order Placed Order Received The Inventory Order Cycle
CO - cost of placing order D - annual demand CC - annual per-unit carrying cost Q - order quantity Annual ordering cost = Annual carrying cost = Total cost = + EOQ Cost Model
Slope = 0 Annual cost ($) Total Cost Minimum total cost Carrying Cost = CcQ/2 Ordering Cost = CoD/Q Order Quantity, Q Optimal order Qopt EOQ Model Cost Curves
CC = $0.75 per yard CO = $150 D = 10,000 yards Find EOQ, TC at Q*, # of order/year, and cycle time NOTE: store days = 311 EOQ Example
Inventory level Maximum inventory level Q(1-d/p) Begin Order receipt Average inventory level Q 2 (1-d/p) 0 Time End Order receipt Order receipt period EOQ With Noninstantaneous Receipt
EOQ With Noninstantaneous Receipt p = production rate d = demand rate
CC = $0.75 per yard CO = $150 D = 10,000 yards d = 10,000/311 = 32.2 yards per day p = 150 yards per day Production Quantity Example
Production run = Q/p = 2,256.8/150 = 15.05 yards Number of production runs = D/Q = 10,000/2,256.8 = 4.43 Production Run and Max Inv. Levels
Safety stock buffer added to on hand inventory during lead time Stockout an inventory shortage Service level probability that the inventory available during lead time will meet demand Safety Stocks
Capacity Constraints Strategic Objectives Company Policies Demand Forecasts Financial Constraints Aggregate Production Planning Size of Workforce Units or dollars subcontracted, backordered, or lost Production per month (in units or $) Inventory Levels Inputs and Outputs to Aggregate Production Planning
Items Production Planning Capacity Planning Resource level Product lines or families Aggregate Resource Plants Production Plan Requirements Plan Individual products Critical work centers Master Production Rough-Cut Schedule Capacity Plan All work centers Material Capacity Components Requirements Plan Requirements Plan Manufacturing operations Individual machines Shop Floor Input/Output Schedule Control Hierarchical Planning Process