Space Reflecto 2013
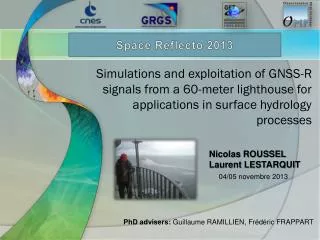
Space Reflecto 2013. Simulations and exploitation of GNSS-R signals from a 60-meter lighthouse for applications in surface hydrology processes. Nicolas ROUSSEL Laurent LESTARQUIT. 04/05 novembre 2013. PhD advisers : Guillaume RAMILLIEN, Frédéric FRAPPART. Plan

Space Reflecto 2013
E N D
Presentation Transcript
SpaceReflecto 2013 Simulations and exploitation of GNSS-R signals from a 60-meter lighthouse for applications in surface hydrology processes Nicolas ROUSSEL Laurent LESTARQUIT 04/05 novembre 2013 PhDadvisers: Guillaume RAMILLIEN, Frédéric FRAPPART
Plan Introduction Simulations Field measurements • Introduction • Simulations • Field measurements • GNSS-based tide gauge system with SILICOM datalogger • Analysis of signal-to-noise ratio (SNR) series 4/5 November 2013 SpaceReflecto – Nicolas ROUSSEL / Laurent LESTARQUIT 2
Plan Introduction Simulations Field measurements • Introduction • Simulations • Field measurements • GNSS-based tide gauge system with SILICOM datalogger • Analysis of signal-to-noise ratio (SNR) series 4/5 November 2013 SpaceReflecto – Nicolas ROUSSEL / Laurent LESTARQUIT 3
Introduction Introduction Simulations Field measurements • Ground configuration • Embedded configuration Source : Institut de Ciències de l’Espai (http://www.ice.csic.es) • Direct/reflectedsignalscorrelation • Position of the specularreflection point • Altimetry • Properties of the reflection surface (roughness) 4/5 November 2013 SpaceReflecto – Nicolas ROUSSEL / Laurent LESTARQUIT 4
Introduction Introduction Simulations Field measurements The Cordouan Lighthouse(45°35’11’’N ; 1°10’24’’O) -60m - 4/5 November 2013 SpaceReflecto – Nicolas ROUSSEL / Laurent LESTARQUIT 5
Plan Introduction Simulations Field measurements • Introduction • Simulations • Field measurements • GNSS-based tide gauge system with SILICOM datalogger • Analysis of signal-to-noise ratio (SNR) series 4/5 November 2013 SpaceReflecto – Nicolas ROUSSEL / Laurent LESTARQUIT 6
Simulations Introduction Simulations Field measurements Simulator development • Modeling the trajectories of GNSS electromagneticwavesthat are reflected on the surface of the Earth, based on real ephemeris • Determine the potential of GNSS-R for mapping the characteristics of the reflecting surface • Explore different configurations of performingmeasurements and instrument installations: • variations in the reflectometer height, mask effects due to the terrain, satellites geometry, ... 4/5 November 2013 SpaceReflecto – Nicolas ROUSSEL / Laurent LESTARQUIT 7
Simulations Introduction Simulations Field measurements • Determination of the position of the specularreflection points: 3 algorithms • Approximation of the Earthinto a local sphere • Approximation of the Earthinto a local ellipsoid • DEM (Digital Elevation Model) integration Gnu R Computation speed Correctness For further information : Simulations of direct and reflectedwavestrajectories for in situ GNSS-R experiments, submitted in Geosciences Model Development N. Roussel, F. Frappart, G. Ramillien, C. Desjardins, P. Gegout, F. Pérosanz, R. Biancale 4/5 November 2013 SpaceReflecto – Nicolas ROUSSEL / Laurent LESTARQUIT 8
Simulations Introduction Simulations Field measurements 4/5 November 2013 SpaceReflecto – Nicolas ROUSSEL / Laurent LESTARQUIT 9
Simulations Introduction Simulations Field measurements Simulator outputs Simulations on the Cordouan lighthouse (45°35’11’’N ; 1°10’24’’O) 4/5 November 2013 SpaceReflecto – Nicolas ROUSSEL / Laurent LESTARQUIT 10
Simulations Introduction Simulations Field measurements Simulations over a week 4/5 November 2013 SpaceReflecto – Nicolas ROUSSEL / Laurent LESTARQUIT 11
Simulations Introduction Simulations Field measurements Simulations over a week 4/5 November 2013 SpaceReflecto – Nicolas ROUSSEL / Laurent LESTARQUIT 12
Plan Introduction Simulations Field measurements • Introduction • Simulations • Field measurements • GNSS-based tide gauge system with SILICOM datalogger • Analysis of signal-to-noise ratio (SNR) series 4/5 November 2013 SpaceReflecto – Nicolas ROUSSEL / Laurent LESTARQUIT 13
Plan Introduction Simulations Field measurements • Introduction • Simulations • Field measurements • GNSS-based tide gauge system with SILICOM datalogger • Analysis of signal-to-noise ratio (SNR) series 4/5 November 2013 SpaceReflecto – Nicolas ROUSSEL / Laurent LESTARQUIT 14
SILICOM Data-logger Introduction Simulations Field measurements SILICOM Data-Logger Data Logger • records and time tags a wide choice of supported RF GNSS signals • makes possible the characterization of the reflected signal and the development of algorithms for processing the GNSS-R signals. 4/5 November 2013 SpaceReflecto – Nicolas ROUSSEL / Laurent LESTARQUIT 15
SILICOM Data-logger Introduction Simulations Field measurements 31stmay 2013 campaign Data Logger to collect GNSS-R signals, receiving the direct signal via a RHCP zenith-looking antenna, and the reflected signal via a LHCP nadir-looking antenna Approx. 25 min of acquisitions, 25 MHz, 8 bits 4/5 November 2013 SpaceReflecto – Nicolas ROUSSEL / Laurent LESTARQUIT 16
SILICOM Data-logger Introduction Simulations Field measurements Acquisition 1 ms Doppler : [-5000:1:5000] Hz • Detection of 6 satellites : • PRN12 • PRN15 • PRN17 • PRN24 • PRN25 • PRN26 In agreement with the simulations 4/5 November 2013 SpaceReflecto – Nicolas ROUSSEL / Laurent LESTARQUIT 17
SILICOM Data-logger Introduction Simulations Field measurements Acquisition PRN15 exemple : detection of the initial doppler Direct signal Reflected signal 4/5 November 2013 SpaceReflecto – Nicolas ROUSSEL / Laurent LESTARQUIT 18
SILICOM Data-logger Introduction Simulations Field measurements Acquisition PRN15 exemple : detection of the initial delay Direct signal Reflected signal 4/5 November 2013 SpaceReflecto – Nicolas ROUSSEL / Laurent LESTARQUIT 19
SILICOM Data-logger Introduction Simulations Field measurements Correlationfunction Reflected signal Direct signal 1 ms 1 ms 100 ms 100 ms 4/5 November 2013 SpaceReflecto – Nicolas ROUSSEL / Laurent LESTARQUIT 20
SILICOM Data-logger Introduction Simulations Field measurements Correlationfunction Reflected signal Direct signal 1 ms 1 ms 100 ms 100 ms 4/5 November 2013 SpaceReflecto – Nicolas ROUSSEL / Laurent LESTARQUIT 21
SILICOM Data-logger Introduction Simulations Field measurements Delay-Doppler Maps Ce sont des GIFS animés ! - 4/5 November 2013 SpaceReflecto – Nicolas ROUSSEL / Laurent LESTARQUIT 24
SILICOM Data-logger Introduction Simulations Field measurements Tracking Determination of the C/A pseudo-distance for both direct and reflectedsignals The differencebetweenbothgives the extra distance traveled by the reflectedwave Differencesbetween direct and reflectedpaths – C/A PRN12 Distance (m) Time (s) : satellite elevation 4/5 November 2013 SpaceReflecto – Nicolas ROUSSEL / Laurent LESTARQUIT 23
SILICOM Data-logger Introduction Simulations Field measurements Tracking With the elevation Direct signal 4/5 November 2013 SpaceReflecto – Nicolas ROUSSEL / Laurent LESTARQUIT 23
Plan Introduction Simulations Field measurements • Introduction • Simulations • Field measurements • GNSS-based tide gauge system with SILICOM datalogger • Analysis of signal-to-noise ratio (SNR) series 4/5 November 2013 SpaceReflecto – Nicolas ROUSSEL / Laurent LESTARQUIT 25
Plan Introduction Simulations Field measurements • Introduction • Simulations • Field measurements • GNSS-based tide gauge system with SILICOM datalogger • Analysis of signal-to-noise ratio (SNR) series 4/5 November 2013 SpaceReflecto – Nicolas ROUSSEL / Laurent LESTARQUIT 26
SNR data Introduction Simulations Field measurements phase difference between the direct signal and the reflected signal (multipath) Multipath amplitude Direct signal amplitude Larson et al., GPS Sol., 2008 x = sin θ : 4/5 November 2013 SpaceReflecto – Nicolas ROUSSEL / Laurent LESTARQUIT 27
SNR data Introduction Simulations Field measurements L2 SNR data 2ndorderpolynom 4/5 November 2013 SpaceReflecto – Nicolas ROUSSEL / Laurent LESTARQUIT 28
SNR data Introduction Simulations Field measurements L2 SNR data 0 – 40° elevation filtration 4/5 November 2013 SpaceReflecto – Nicolas ROUSSEL / Laurent LESTARQUIT 29
SNR data Introduction Simulations Field measurements L2 SNR data The whole 3 months time seriesiscurrentlybeinganalyzed in order to make the tideappear 4/5 November 2013 SpaceReflecto – Nicolas ROUSSEL / Laurent LESTARQUIT 30